In this script, we will work with the audio files we extracted from XDF file. We will extract the following features:
intensity
f0
spectral centroid / spectral center of gravity
formants
Code to load packages and prepare the environment
# packagesimport osimport globimport numpy as npimport pandas as pdimport matplotlib.pyplot as pltimport scipyfrom scipy.signal import butter, filtfilt, sosfiltimport librosaimport parselmouthimport matplotlib.pyplot as pltimport IPython.display as ipdimport seaborn as snsfrom scipy.signal import find_peaks, peak_widthsimport pickleimport randomcurfolder = os.getcwd()# files to work withACfolder = os.path.join(curfolder, '..', '01_XDF_processing', 'data', 'Data_processed', 'Data_trials', 'Audio_48')# folders to save the processed dataACfolder_processed = os.path.join(curfolder, 'TS_acoustics')ifnot os.path.exists(ACfolder_processed): os.makedirs(ACfolder_processed)actotrack = glob.glob(os.path.join(ACfolder, "*.wav"))print('Number of audio files found: ', len(actotrack))# get rid of _pr_ filesactotrack = [f for f in actotrack if'_pr_'notin f]print('Number of audio files after removing _pr_ files: ', len(actotrack))
Number of audio files found:  10378
Number of audio files after removing _pr_ files:  8101
Here is an audio example
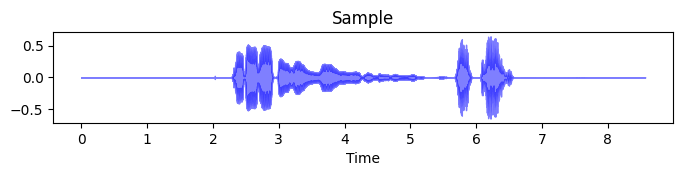
And here it is visualized as a waveform
Custom functions
def chunk_and_smooth(df, var, window=25, order=3):""" Processes a DataFrame by identifying contiguous non-NaN segments (chunks) in a specified column, then applies Savitzky-Golay smoothing to each sufficiently long chunk. Parameters: ----------- df : pandas.DataFrame Input DataFrame containing the data to be processed var : str Name of the column to process window : int, optional Window length for Savitzky-Golay filter (default: 25) order : int, optional Polynomial order for Savitzky-Golay filter (default: 3) Returns: -------- pandas.DataFrame Processed DataFrame with smoothed values in the specified column Notes: ------ - Chunks are defined as contiguous non-NaN values in the specified column - Only chunks with length >= 5 are smoothed - The original DataFrame is not modified; a new DataFrame is returned """ df['chunk'] =None chunk =0for index, row in df.iterrows():if np.isnan(row[var]):continueelse: df.loc[index, 'chunk'] = chunk# if the next value is NaN or this is the last row, increase the chunkif index ==len(df)-1:continueelif np.isnan(df.loc[index+1, var]): chunk +=1# now we can smooth the spectralCent values in each chunk chunks = df['chunk'].unique()# skip if chunks are empty (that means that there is no var trace)iflen(chunks) >1:# ignore the first chunk (None) chunks = chunks[1:]for chunk in chunks:# get the rows of the chunk chunkrows = df[df['chunk'] == chunk].copy()# dont smooth chunks shorter than 5iflen(chunkrows) <5:continueelse:# smooth var with savgol filter chunkrows[var] = scipy.signal.savgol_filter(chunkrows[var], window, order) # put it back to the df df.loc[df['chunk'] == chunk, var] = chunkrows[var]# get rid of the chunk column df = df.drop('chunk', axis=1)return df
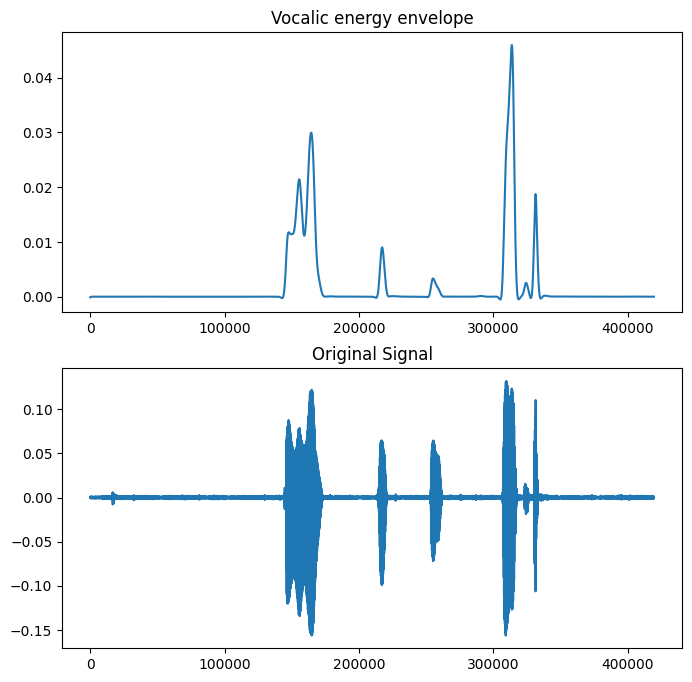
Extracting intensity (vocalic energy)
To extract the amplitude envelope of the acoustic signal, we follow a method by Tilsen & Arvaniti (2013), adapted by Pouw (2024). We use a bandpass and 2nd order 10Hz low-pass zero-phase Butterworth filter.
Code with functions to extract the amplitude envelope
def butter_bandpass(lowcut, highcut, fs, order=2):"""Design a Butterworth bandpass filter. Args: lowcut: Lower frequency bound of the bandpass filter (Hz) highcut: Upper frequency bound of the bandpass filter (Hz) fs: Sampling frequency (Hz) order: Order of the filter (default: 2) Returns: b: Numerator coefficients of the filter a: Denominator coefficients of the filter """ nyquist =0.5* fs low = lowcut / nyquist high = highcut / nyquist b, a = butter(order, [low, high], btype='band')return b, adef butter_bandpass_filtfilt(data, lowcut, highcut, fs, order=2):"""Apply a Butterworth bandpass filter to the input data using filtfilt. Args: data: Input signal to be filtered lowcut: Lower frequency bound of the bandpass filter (Hz) highcut: Upper frequency bound of the bandpass filter (Hz) fs: Sampling frequency (Hz) order: Order of the filter (default: 2) Returns: y: Filtered signal """ b, a = butter_bandpass(lowcut, highcut, fs, order=order) y = filtfilt(b, a, data)return y# Define the lowpass filterdef butter_lowpass(cutoff, fs, order=2):"""Design a Butterworth lowpass filter. Args: cutoff: Cutoff frequency of the lowpass filter (Hz) fs: Sampling frequency (Hz) order: Order of the filter (default: 2) Returns: b: Numerator coefficients of the filter a: Denominator coefficients of the filter """ nyquist =0.5* fs normal_cutoff = cutoff / nyquist b, a = butter(order, normal_cutoff, btype='low')return b, adef butter_lowpass_filtfilt(data, cutoff, fs, order=2):"""Apply a Butterworth lowpass filter to the input data using filtfilt. Args: data: Input signal to be filtered cutoff: Cutoff frequency of the lowpass filter (Hz) fs: Sampling frequency (Hz) order: Order of the filter (default: 2) Returns: y: Filtered signal """ b, a = butter_lowpass(cutoff, fs, order=order) y = filtfilt(b, a, data)return y# Function to extract amplitude envelopedef amp_envelope(audiofilename):"""Extract the amplitude envelope from an audio file. Args: audiofilename: Path to the audio file Returns: data: The amplitude envelope of the filtered signal sr: Sampling rate of the audio file """# load audio with librosa audio, sr = librosa.load(audiofilename, sr=None, mono=True)# Bandpass filter 400-4000Hz data = butter_bandpass_filtfilt(audio, 400, 4000, sr, order=2)# Lowpass filter 10Hz data = butter_lowpass_filtfilt(np.abs(data), 10, sr, order=2)return data, sr
Here is an example how the vocalic energy is extracted
Now we loop over all the audio files and extract the vocalic energy.
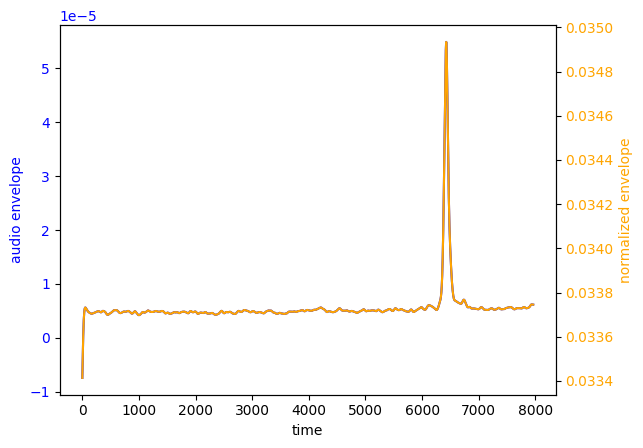
Note that we updated the pipeline such that we first extract envelope for all trials and sessions and only later normalize within participant and extract envelope change. Before, we normalized within a trial which was an unintended mistake.
env_error = []# Loop over wav filesfor audiofile in actotrack:if'_rein_'in audiofile: trialid = audiofile.split(os.sep)[-1].split('.')[0] trialid = trialid.split('_')[0] +'_'+ trialid.split('_')[1] +'_'+ trialid.split('_')[2] +'_'+ trialid.split('_')[4] +'_'+ trialid.split('_')[8]else:# get the trialid trialid = audiofile.split(os.sep)[-1].split('.')[0] trialid ='_'.join(trialid.split('_')[0:1] + trialid.split('_')[1:2] + trialid.split('_')[3:4] + trialid.split('_')[7:8]) sessionid = trialid.split('_')[0] + trialid.split('_')[1]print('working on '+ trialid)# apply the function ampv, sr = amp_envelope(audiofile)# Extract and plot the original signal rawaudio, sr = librosa.load(audiofile, sr=None)# create a time vector time_env = np.arange(0, len(rawaudio)/sr, 1/sr)# Ensure the lengths match by padding ampv if necessary (Note that is a quick fix)iflen(ampv) <len(time_env): ampv = np.pad(ampv, (0, len(time_env) -len(ampv)), mode='constant')eliflen(ampv) >len(time_env): ampv = ampv[:len(time_env)]# the same for rawaudioiflen(rawaudio) <len(time_env): rawaudio = np.pad(rawaudio, (0, len(time_env) -len(rawaudio)), mode='constant')eliflen(rawaudio) >len(time_env): rawaudio = rawaudio[:len(time_env)]# save the audio and envelopetry: audio = pd.DataFrame({'time': time_env, 'audio': rawaudio, 'envelope': ampv, 'trialID': trialid})# convert time to ms audio['time'] = audio['time'] *1000# write as csv audio.to_csv(os.path.join(ACfolder_processed, 'env_'+ trialid +'_nenorm.csv'), index=False)exceptValueError:print('ValueError: '+ trialid) env_error.append(trialid)continue
Now we will collect envelope min and max in order to min-max normalize within participant such that all values are between 0 and 1.
if os.path.exists(os.path.join(ACfolder_processed, 'env_norm_dict.pkl')):withopen(os.path.join(ACfolder_processed, 'env_norm_dict.pkl'), 'rb') as f: env_norm_dict = pickle.load(f)else: env_error = [] env_norm_dict = {}# Loop over wav filesfor audiofile in actotrack:if'_rein_'in audiofile: trialid = audiofile.split(os.sep)[-1].split('.')[0] trialid = trialid.split('_')[0] +'_'+ trialid.split('_')[1] +'_'+ trialid.split('_')[2] +'_'+ trialid.split('_')[4] +'_'+ trialid.split('_')[8]else:# get the trialid trialid = audiofile.split(os.sep)[-1].split('.')[0] trialid ='_'.join(trialid.split('_')[0:1] + trialid.split('_')[1:2] + trialid.split('_')[3:4] + trialid.split('_')[7:8]) sessionid = trialid.split('_')[0] + trialid.split('_')[1]print('working on '+ trialid)# get the envelope values df = pd.read_csv(os.path.join(ACfolder_processed, 'env_'+ trialid +'_nenorm.csv')) ampv = df['envelope'].values# calculate mean, sd, min and max mean_env = np.mean(ampv) sd_env = np.std(ampv) min_env = np.min(ampv) max_env = np.max(ampv)# store in dict env_norm_dict[trialid] = {'mean': mean_env,'sd': sd_env,'min': min_env,'max': max_env}# save the dictwithopen(os.path.join(ACfolder_processed, 'env_norm_dict.pkl'), 'wb') as f: pickle.dump(env_norm_dict, f)
# reorganize the dictionary to get min-max per session & participantdf_norm = pd.DataFrame.from_dict(env_norm_dict, orient='index')df_norm['trialid'] = df_norm.indexparts = df_norm['trialid'].str.split('_', expand=True)df_norm['session'] = parts[0] # row-wise participant extractiondf_norm['participant'] = np.where( df_norm['trialid'].str.contains('rein'), parts[4], # rein case parts[3] # non-rein case)df_norm['session_participant'] = df_norm['session'] +'_'+ df_norm['participant']# now get min and max per session_participantgroup_minmax = ( df_norm .groupby('session_participant') .agg( group_min=('min', 'min'), group_max=('max', 'max') ) .reset_index())# in trialid, replace rein_ with nothingdf_norm['trialid'] = df_norm['trialid'].str.replace('rein_', '')df_norm = df_norm.merge(group_minmax, on='session_participant', how='left')
Now we normalize by min-max
envtotrack = glob.glob(os.path.join(ACfolder_processed, "env_*_nenorm.csv"))sr =48000# loop, normalize by min-maxforfilein envtotrack:print('Normalizing '+file) df = pd.read_csv(file) trialid = df['trialID'].values[0] trialid = trialid.replace('rein_', '')# get the group min and max group_min = df_norm[df_norm['trialid'] == trialid]['group_min'].values[0] group_max = df_norm[df_norm['trialid'] == trialid]['group_max'].values[0]# normalize the envelope df['envelope_norm'] = (df['envelope'] - group_min) / (group_max - group_min)# perform also envelope change df['envelope_change'] = np.insert(np.diff(df['envelope']), 0, 0)# smooth df['envelope_change'] = butter_lowpass_filtfilt(np.abs(df['envelope_change']), 10, sr, order=2)# multiply by sr to get in units in s (not per frame) df['envelope_change'] = df['envelope_change'] * sr# save the normalized envelope df.to_csv(os.path.join(ACfolder_processed, 'env_'+ trialid +'_norm.csv'), index=False)# # plot both envelopes for checking# plt.figure(figsize=(10, 5))# plt.plot(df['time'], df['envelope'], label='Original Envelope')# plt.plot(df['time'], df['envelope_norm'], label='Normalized Envelope')# plt.title(f'Envelope Normalization Check for {trialid}')# plt.xlabel('Time (ms)')# plt.ylabel('Amplitude')# plt.legend()# plt.show()
Because we need take into consideration the sex of participant to set the f0 range accordingly, prior to this script we have extracted the speakers’ register using Praat script Get_Speakers_register.praat from Celine De Looze and save it in file SpeakerRegister.txt.
Now, we first check the mean min and max f0 values across all available data and set the range accordingly.
# this is where we store the min-max f0 values of each speakerregister = pd.read_csv(os.path.join(curfolder, 'SpeakerRegister.txt'), sep='\t') # here we store metadata for each session about sexmeta = pd.read_csv(os.path.join(curfolder, '..', '00_raw', 'all_demodata.csv'))
# now we want to find out the range for males and femalesregister['sex'] =None# make f0min and f0max numericregister['f0min'] = pd.to_numeric(register['f0min'], errors='coerce')register['f0max'] = pd.to_numeric(register['f0max'], errors='coerce')# loop over rows in register,for idx, row in register.iterrows():# get sessionID from FILE (first part) sessionID = row['FILE'].split('_')[0]# get pcn id pcn = row['FILE'].split('_')[7]# merge it ID = sessionID +'_'+ pcn ID = ID.replace('p', '')# find this id in meta and save in sex the value in column sex sex = meta[meta['pcn_ID'] == ID]['sex'].values[0]# save value of sex in current row register.at[idx, 'sex'] = sex# now group sex by each value and find the mean of f0min and f0maxf0min = register.groupby('sex')['f0min'].mean()f0max = register.groupby('sex')['f0max'].mean()# bind in dfdf_register = pd.DataFrame({'f0min': f0min, 'f0max': f0max})df_register.head(5)
f0min
f0max
sex
man
158.956522
311.869565
vrouw
178.267176
377.801527
Code with function to extract the fundamental frequency
def extract_f0(locationsound, sex): # Extract fundamental frequency from audio file""" Extracts the fundamental frequency (F0) from an audio file. Parameters: - locationsound (str): Path to the audio file - sex (str): 'vrouw' for female, other for male (determines F0 range) Returns: - tuple: (Sound object, numpy array of F0 values) """# read the sound file as numpy array audio, sr = librosa.load(locationsound, sr=48000)# read the sound file into Python snd = parselmouth.Sound(audio, sampling_frequency=sr)if sex =='vrouw': f0min =178## calculated by previous chunk f0max =378else: f0min =159 f0max =312 pitch = snd.to_pitch(time_step =0.002, pitch_floor=f0min, pitch_ceiling=f0max) # time_step to get 500Hz f0_values = pitch.selected_array['frequency']return snd, f0_values
Now we loop over all audio files and extract f0 from each. Resulting f0 contours were smoothed with a Savitzky-Golay 3rd-polynomial filter with a span of 50 ms (following Fuchs et al., 2016) applied to continuous runs of phonated vocalization to maintain discontinuities typical of the f0 signal.
freq=48000meta = metaf0_error = []# Loop over wav filesfor audiofile in actotrack:if'_rein_'in audiofile: trialid = audiofile.split('\\')[-1].split('.')[0] trialid = trialid.split('_')[0] +'_'+ trialid.split('_')[1] +'_'+ trialid.split('_')[2] +'_'+ trialid.split('_')[4] +'_'+ trialid.split('_')[8]else:# get the trialid trialid = audiofile.split('\\')[-1].split('.')[0] trialid ='_'.join(trialid.split('_')[0:1] + trialid.split('_')[1:2] + trialid.split('_')[3:4] + trialid.split('_')[7:8]) sessionid = trialid.split('_')[0] + trialid.split('_')[1]print('working on '+ trialid)#check if the processed file already existsif'f0_'+ trialid +'.csv'in os.listdir(ACfolder_processed):print('File already exists, skipping...')continue# first element is sessionid, fourth element is participantid sessionid = trialid.split('_')[0]if'_rein_'in audiofile: participantid = trialid.split('_')[4]else: participantid = trialid.split('_')[3] ID = sessionid +'_'+ participantid# get rid of the 'p' ID = ID.replace('p', '')# what sex has this ID in meta sex = meta[meta['pcn_ID'] == ID]['sex'].values[0]# apply the function snd, f0 = extract_f0(audiofile, sex) length =len(f0)# replace 0 values with NaN f0 = np.where(f0 ==0, np.nan, f0)# create time vector F0_time = np.linspace(0, snd.duration, len(f0)) *1000# Generate time vector# create df f0_df = pd.DataFrame({'time_ms': F0_time, 'f0': f0, 'ID': trialid})# Smooth the f0 valuestry: f0_df = chunk_and_smooth(f0_df, 'f0') # do it with window 25exceptValueError:try:# unless there is only tiny chunk of f0 and then we need window of 5print('ValueError: '+ trialid +', f0 trace is smaller than window length, resuming to window=5') f0_df = chunk_and_smooth(f0_df, 'f0', window=5)exceptValueError:print('ValueError: '+ trialid +', even with window=5, skipping f0 extraction') f0_error.append(trialid)continue# write as csv f0_df.to_csv(os.path.join(ACfolder_processed, 'f0_'+ trialid +'.csv'), index=False)
Here is an example of a file
time_ms
f0
ID
0
0.000000
NaN
10_1_11_p1
1
2.003642
NaN
10_1_11_p1
2
4.007285
NaN
10_1_11_p1
3
6.010927
NaN
10_1_11_p1
4
8.014569
NaN
10_1_11_p1
5
10.018212
NaN
10_1_11_p1
6
12.021854
NaN
10_1_11_p1
7
14.025496
NaN
10_1_11_p1
8
16.029139
NaN
10_1_11_p1
9
18.032781
NaN
10_1_11_p1
10
20.036423
NaN
10_1_11_p1
11
22.040066
NaN
10_1_11_p1
12
24.043708
NaN
10_1_11_p1
13
26.047351
NaN
10_1_11_p1
14
28.050993
NaN
10_1_11_p1
And here visualized
Extracting spectral centroid
To extract the spectral center of gravity (CoG), we first compute a cepstral envelope to smooth the magnitude spectrum while preserving its overall shape. The envelope is obtained via low-time liftering in the cepstral domain (keeping only the lowest frequencies), which suppresses fine harmonic structure without distorting the spectral contour. The CoG is then computed as the power-weighted mean frequency of this envelope — equivalent to a spectral centroid, but applied to the smoothed rather than raw spectrum.
Functions to compute cepstral envelope and center of gravity
# function to compute cepstral envelopedef cepstral_envelope(mag, lifter_cutoff=30):"""Compute cepstral envelope from magnitude spectrum. Args: mag: Magnitude spectrum (positive frequencies only) lifter_cutoff: Number of low quefrencies to keep (default: 30) Returns: envelope: Smoothed magnitude spectrum (positive frequencies only) """# Avoid log(0) mag_safe = np.maximum(mag, 1e-12)# Log-magnitude spectrum log_mag = np.log(mag_safe)# We assume `mag` comes from an rFFT of length N_fft = 2*(N_bins-1) N_bins = mag_safe.shape[0] N_fft =2* (N_bins -1)# Real cepstrum cepstrum = np.fft.irfft(log_mag, n=N_fft)# Low-time liftering: keep only low quefrencies liftered = np.zeros_like(cepstrum) liftered[:lifter_cutoff] = cepstrum[:lifter_cutoff]# Back to (smoothed) log spectrum (positive freqs only) smooth_log_mag = np.fft.rfft(liftered)# Envelope magnitude envelope = np.exp(np.real(smooth_log_mag))# Safety: ensure same length envelope = envelope[:N_bins]return envelope# function to compute center of gravitydef cog_from_envelope(freqs, envelope):"""Compute center of gravity from frequency envelope. Args: freqs: Frequency bins (positive frequencies only) envelope: Smoothed magnitude spectrum (positive frequencies only) Returns: cog: Center of gravity frequency (Hz) """ power_spec = envelope **2 total_power = np.sum(power_spec)if total_power <=0:return np.nanreturn np.sum(freqs * power_spec) / total_power
window_length =0.03# 30 ms analysis windowfor audiofile in actotrack:# Extract trial ID from filenameif'_rein_'in audiofile: trialid = os.path.basename(audiofile).split('.')[0] trialid = trialid.split('_')[0] +'_'+ trialid.split('_')[1] +'_'+ trialid.split('_')[4] +'_'+ trialid.split('_')[8]else: trialid = os.path.basename(audiofile).split('.')[0] trialid ='_'.join( trialid.split('_')[0:1] + trialid.split('_')[1:2] + trialid.split('_')[3:4] + trialid.split('_')[7:8] ) sessionid = trialid.split('_')[0] + trialid.split('_')[1]# check if the processed file already existsiff'cog_{trialid}.csv'in os.listdir(ACfolder_processed):print('File already exists, skipping...')continueprint(f'Working on {trialid}')# Extract session and participant ID sessionid = trialid.split('_')[0] participantid = trialid.split('_')[3] ID =f"{sessionid}_{participantid}"# Load sound snd = parselmouth.Sound(audiofile)# Get sampling rate fs = snd.sampling_frequency filtered_sound = snd # use the original sound# Compute spectrogram spectrogram = filtered_sound.to_spectrogram(window_length=window_length)# Time points (s) times = spectrogram.xs() cog_values = []for t in times:# Spectrum slice at time t (parselmouth.Spectrum) spec_slice = spectrogram.to_spectrum_slice(time=t)# Frequencies (Hz) and magnitude spectrum freqs = spec_slice.xs() # shape (N_bins,) mag = np.abs(spec_slice.values[0, :]) # shape (N_bins,)# Smoothed spectral envelope (Option C) envelope = cepstral_envelope(mag, lifter_cutoff=30)# CoG of the envelope cog = cog_from_envelope(freqs, envelope) cog_values.append(cog)# Convert to numpy time_cog = np.array(times) *1000# ms cog_values = np.array(cog_values)# Create DataFrame cog_df = pd.DataFrame({'time': time_cog, 'CoG': cog_values, 'TrialID': trialid})# Replace zeros with NaN (if any silent frames ended up as 0) cog_df['CoG'] = cog_df['CoG'].replace(0, np.nan)# Smooth the CoG tracetry: cog_df = chunk_and_smooth(cog_df, 'CoG')exceptValueError:print(f'ValueError: {trialid}, CoG trace is smaller than window length, using window=5') cog_df = chunk_and_smooth(cog_df, 'CoG', window=5)# Save output_path = os.path.join(ACfolder_processed, f'cog_{trialid}.csv') cog_df.to_csv(output_path, index=False)
This is a visual example of a file
Extracting formants
To extract formant values, we use Chris Carignan’s Praat script (see Github) which optimizes the F1-F5 values.
To verify the sensibility of the data, we will do some visual inspections. Moreover, we will consider taking formant values from the windows of envelope amplitude peaks.
Code to prepare the environment
# Here we store formants from praatformantfolder = os.path.join(curfolder, 'TS_acoustics')formants = glob.glob(os.path.join(formantfolder, '*formants*.csv'))print('Number of formant files found: ', len(formants))# Here we store processed envelope envfiles = glob.glob(os.path.join(ACfolder_processed, 'env_*.csv'))
Number of formant files found: 7989
# inititate empty dfformants_df = pd.DataFrame()# loop over formants, but only random 250 filesformantfiles = random.sample(formants, 500)for formant in formantfiles:print('working on '+ formant) for_df = pd.read_csv(formant)# get the name of the file filename = os.path.basename(formant)# in filename, look for c1, c2, c0if'c1'in filename: for_df['correction'] ='c1'elif'c2'in filename: for_df['correction'] ='c2'elif'c0'in filename: for_df['correction'] ='c0'else: for_df['correction'] ='none'# add filename for_df['filename'] = filename# concatenate formants_df = pd.concat([formants_df, for_df])# get rid of rows with correction = noneformants_df = formants_df[formants_df['correction'] !='none']
This is how the formants look like in a table
time
f1
f2
f3
f4
f5
correction
filename
0
0.027219
727.817320
2009.853634
3092.934297
4095.976250
5264.917801
c1
32_2_trial_61_Mic_nominal_srate48000_p1_horen_...
1
0.032219
764.428525
2044.244397
3056.891481
4235.136011
5666.616887
c1
32_2_trial_61_Mic_nominal_srate48000_p1_horen_...
2
0.037219
863.528190
2058.925213
3389.860531
4353.668921
0.000000
c1
32_2_trial_61_Mic_nominal_srate48000_p1_horen_...
3
0.042219
850.111034
2004.787062
3349.519694
4419.755826
0.000000
c1
32_2_trial_61_Mic_nominal_srate48000_p1_horen_...
4
0.047219
965.060383
1897.454079
3266.788806
4476.258975
0.000000
c1
32_2_trial_61_Mic_nominal_srate48000_p1_horen_...
5
0.052219
1504.681366
1741.942775
3280.178309
4460.621848
0.000000
c1
32_2_trial_61_Mic_nominal_srate48000_p1_horen_...
6
0.057219
1352.878211
2368.123912
3316.292778
4464.975176
0.000000
c1
32_2_trial_61_Mic_nominal_srate48000_p1_horen_...
7
0.062219
815.471505
1907.991116
3133.023819
4272.875977
5559.892681
c1
32_2_trial_61_Mic_nominal_srate48000_p1_horen_...
8
0.067219
711.213221
2024.522274
3158.735727
4126.455312
5437.906297
c1
32_2_trial_61_Mic_nominal_srate48000_p1_horen_...
9
0.072219
717.527044
2035.717171
2896.428858
4081.450654
5434.238219
c1
32_2_trial_61_Mic_nominal_srate48000_p1_horen_...
10
0.077219
760.359284
2034.032242
3022.501246
4243.017208
0.000000
c1
32_2_trial_61_Mic_nominal_srate48000_p1_horen_...
11
0.082219
654.756518
1983.749046
3167.025178
4349.883181
0.000000
c1
32_2_trial_61_Mic_nominal_srate48000_p1_horen_...
12
0.087219
1271.798764
2221.605229
3569.063344
4544.064149
0.000000
c1
32_2_trial_61_Mic_nominal_srate48000_p1_horen_...
13
0.092219
539.081858
2097.328475
3963.144468
4362.677361
0.000000
c1
32_2_trial_61_Mic_nominal_srate48000_p1_horen_...
14
0.097219
1259.821747
2323.795250
3815.730308
4635.231140
0.000000
c1
32_2_trial_61_Mic_nominal_srate48000_p1_horen_...
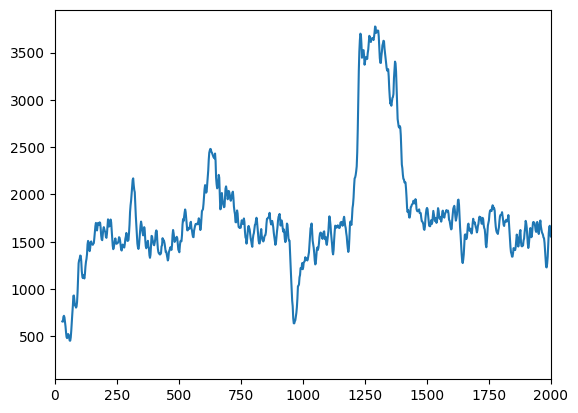
This is how the formants look for a single trial.
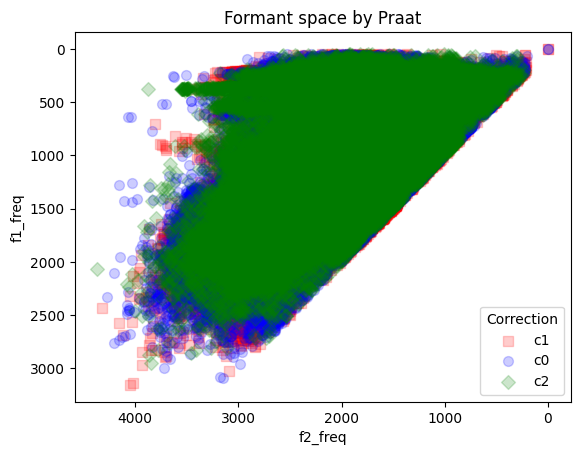
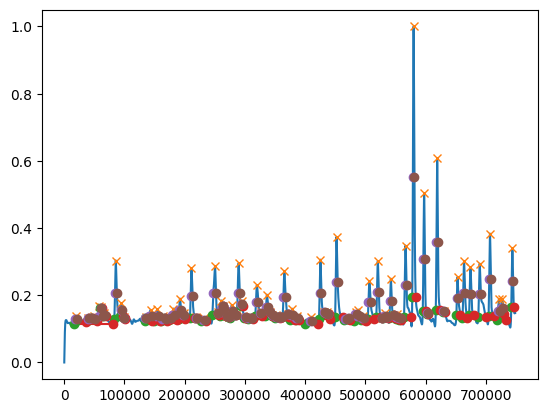
Now let’s look at the vowel space area across all data.
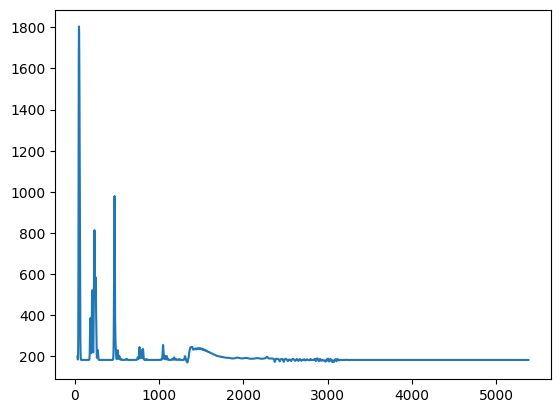
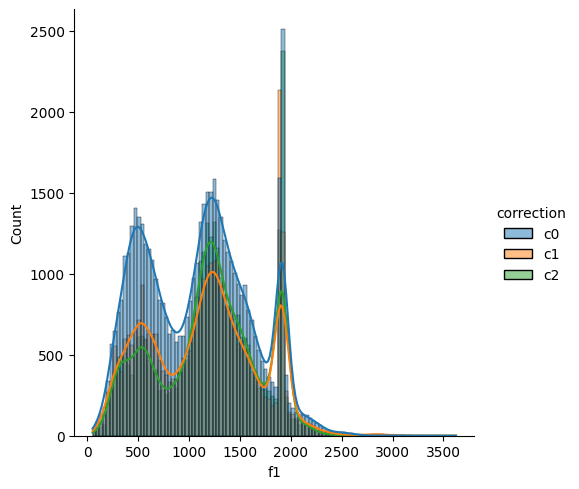
And this is distribution of f1 across all data.
This all looks reasonable. However, we should still be careful. Formant values are most reliable where f0 is present. Since in this project, we work with non-speech sounds, they are frequently unvoiced. Because research shows that there are also weak ‘formants’ beyond f0 contour, resulting, for instance, from resonances of sub- and supraglottal tract during breathing (Werner et al., 2024), we will also consider formant values in the moments of envelope peaks. This will maximize the number of data points we can use for analysis.
We can use findpeaks() function from the signal package to find the peaks in the envelope. We can then use these peaks as a reference point for formant extraction.
# collect filenames from formants_dffilenames = formants_df['filename'].unique()# from each, get 0,1,3, 7 elements sep. by _ if there is no _rein_, if yes, then 0,1,4,8env_ids = []for filename in filenames:if'_rein_'in filename: env_id = filename.split('_')[0] +'_'+ filename.split('_')[1] +'_'+ filename.split('_')[2] +'_'+ filename.split('_')[4] +'_'+ filename.split('_')[8]else: env_id = filename.split('_')[0] +'_'+ filename.split('_')[1] +'_'+ filename.split('_')[3] +'_'+ filename.split('_')[7] env_ids.append(env_id)# to each, put _ in the beginningenv_ids = ['env_'+ eid +'.csv'for eid in env_ids]
env_df = pd.DataFrame()envfiles = [os.path.join(ACfolder_processed, eid) for eid in env_ids if os.path.exists(os.path.join(ACfolder_processed, eid))]# loop over env files and make a giga df from allfor envfile in envfiles: df = pd.read_csv(envfile) env_df = pd.concat([env_df, df])
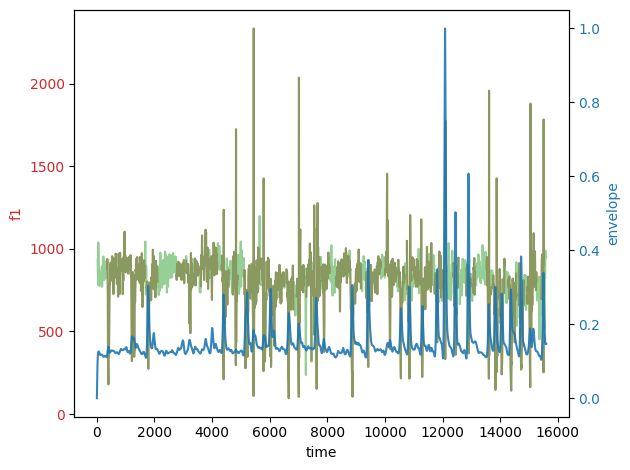
Using peak_width function, we can extract the window of an envelope peak. Further, we can define the relative height of the peak to adjust the window size. Here, we try relative height of 0.5 and 0.9
# rename trialID to trialidenv_df = env_df.rename(columns={'trialID': 'trialid'})# pick one trialid from env_dftrialid = env_df['trialid'].sample(1).values[0]# get the env for this trialid from env_dfenv_trial = env_df[env_df['trialid'] == trialid]# find peaks, min height is mean of the envpeaks, _ = find_peaks(env_trial['envelope'], height=np.mean(env_df['envelope']))# get the width of the peaksresults_half = peak_widths(env_trial['envelope'], peaks, rel_height=0.5)results_full = peak_widths(env_trial['envelope'], peaks, rel_height=0.9)
Now we can check envelope peak widths against formant values. In merged dataframe with both formants and envelope, we will annotate peak widths, so that we know which values of formants to consider (the rest we turn to NA)
formantid = trialid.split('_')[0] +'_'+ trialid.split('_')[1] +'_trial_'+ trialid.split('_')[2]# find in formant_df rows with this formantid in filenameformants_trial = formants_df[formants_df['filename'].str.contains(formantid)]# convert time to msformants_trial['time'] = formants_trial['time'] *1000# merge formants1 and formants2 on trialid and time, outer methodmerged_df = pd.merge(env_trial, formants_trial, on=['time'], how='outer')# cols to intcolstoint = ['f1', 'f2', 'f3', 'f4', 'f5']#interpolate for col in colstoint: merged_df[col] = merged_df[col].interpolate(method='linear', x = merged_df['time'])#delete rows where envelope is NaNmerged_df = merged_df.dropna(subset=['envelope'])# check the width of the peakspeaks, _ = find_peaks(merged_df['envelope'], height=np.mean(env_df['envelope'])) # minimum height of the peak is mean of the envelope (across all data)# get the width of the peaksresults_width = peak_widths(merged_df['envelope'], peaks, rel_height=0.9)# create column peak_width and put 1 everywhere between start and end of the peakmerged_df['peak_width'] =0# create a table from the results_half[2] and results_half[3]peak_w = pd.DataFrame({'start': results_width[2], 'end': results_width[3]})# loop over the rows of the peak_w and put 1 in the peak_width column between start and endfor i, row in peak_w.iterrows(): merged_df.loc[row['start']:row['end'], 'peak_width'] =1# for each formant column, create new f_clean column and put the value of the formant where peak_width = 1for col in colstoint: merged_df[col +'_clean'] = merged_df[col] * merged_df['peak_width']#instead of 0, put NaN merged_df[col +'_clean'] = merged_df[col +'_clean'].replace(0, np.nan)
Here we can see visualized overlap of formants and envelope (peaks). The darker part of the formants signal is the window of an envelope peak.
In merging script, we will get back to this and use both envelope peaks and f0 to define the relevant formant windows.
References
Fuchs, S., Reichel, U., & Rochet-Capellan, A. (2016, March). F0 declination and speech planning in face to face dialogues. https://doi.org/10.13140/RG.2.1.4909.0320
Jadoul, Y., Thompson, B., & de Boer, B. (2018). Introducing Parselmouth: A Python interface to Praat. Journal of Phonetics, 71, 1–15. https://doi.org/10.1016/j.wocn.2018.07.001
Tilsen, S., & Arvaniti, A. (2013). Speech rhythm analysis with decomposition of the amplitude envelope: Characterizing rhythmic patterns within and across languages. The Journal of the Acoustical Society of America, 134(1), 628–639. https://doi.org/10.1121/1.4807565
Werner, R., Fuchs, S., Trouvain, J., Kürbis, S., Möbius, B., & Birkholz, P. (2024). Acoustics of breath noises in human speech: Descriptive and three-dimensional modeling approaches. Journal of Speech, Language, and Hearing Research, 67(10S), 3947–3961. https://doi.org/10.1044/2023\_JSLHR-23-00112