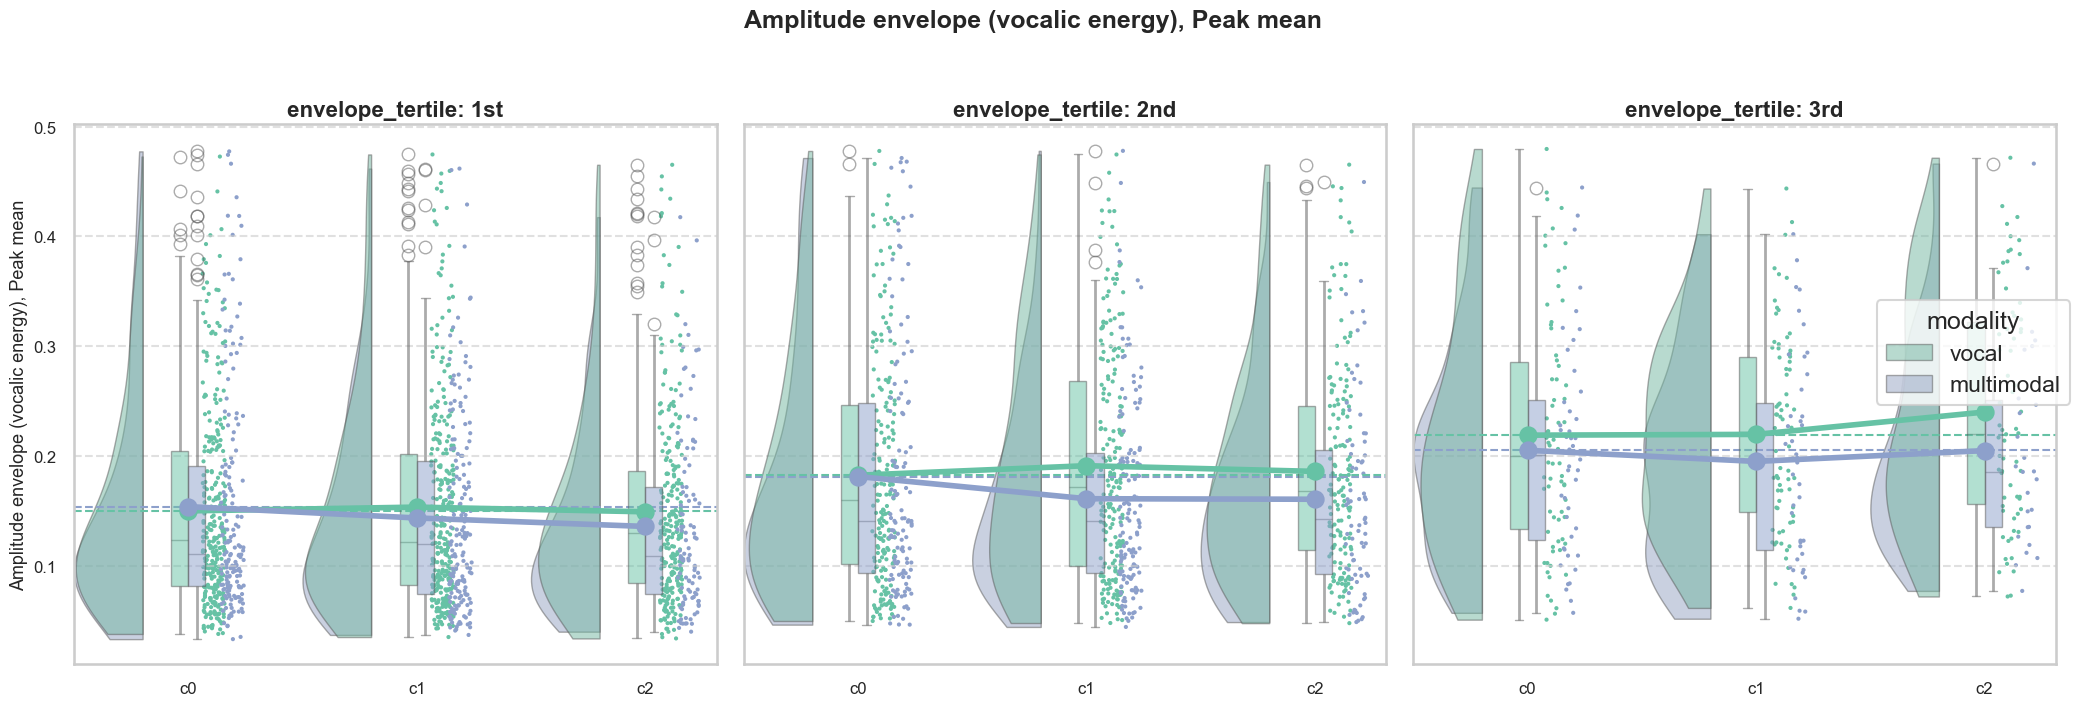
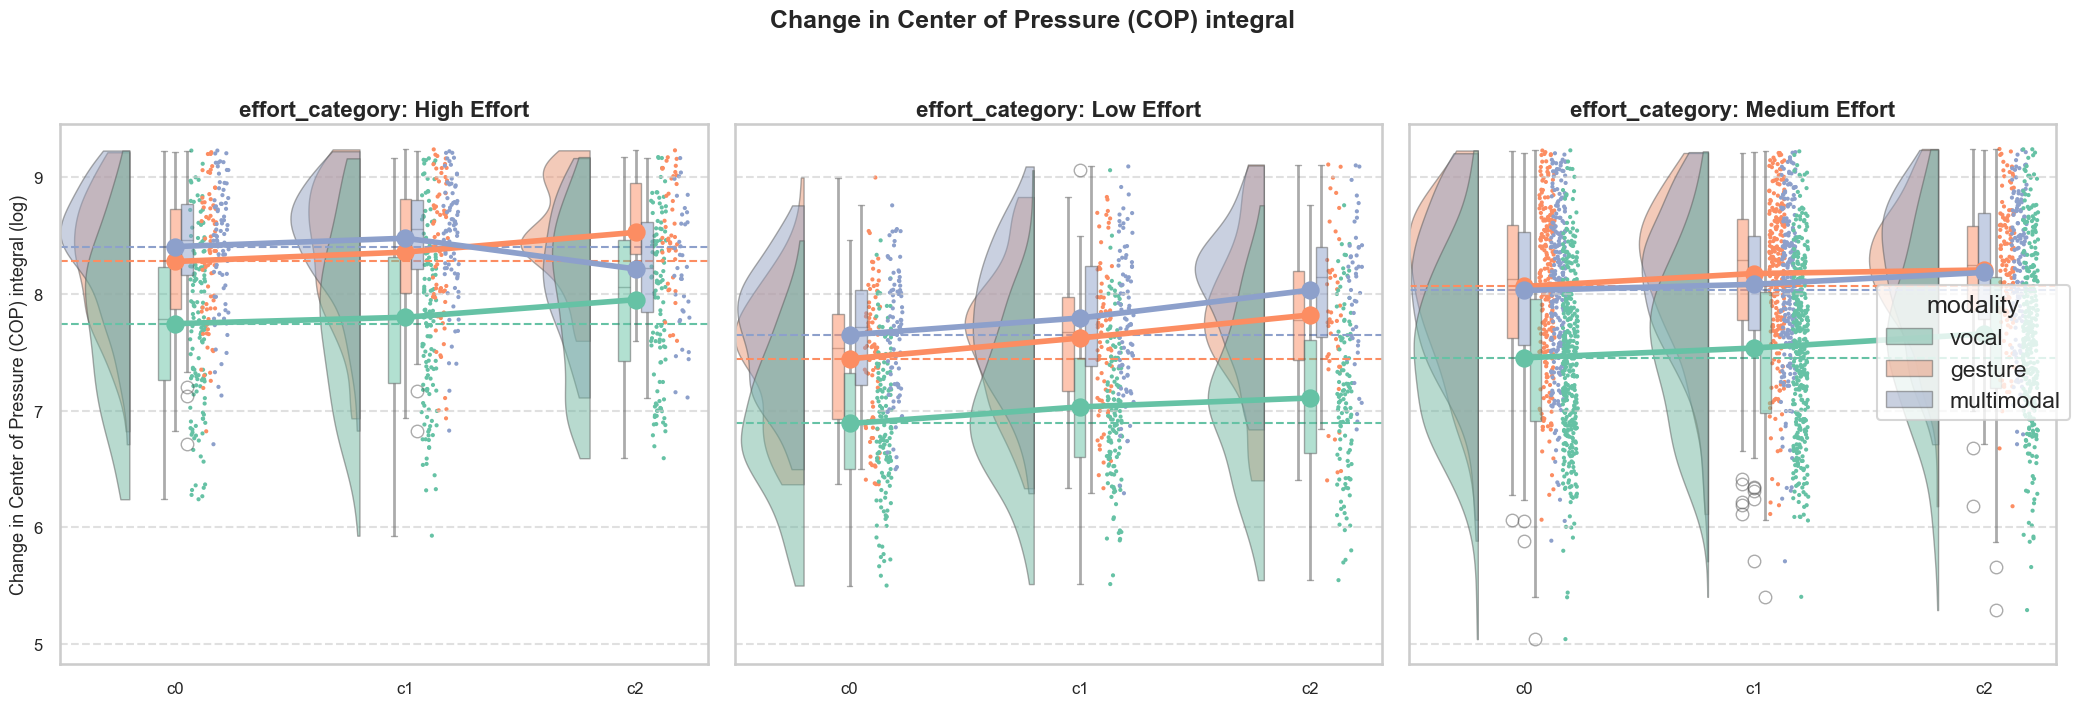
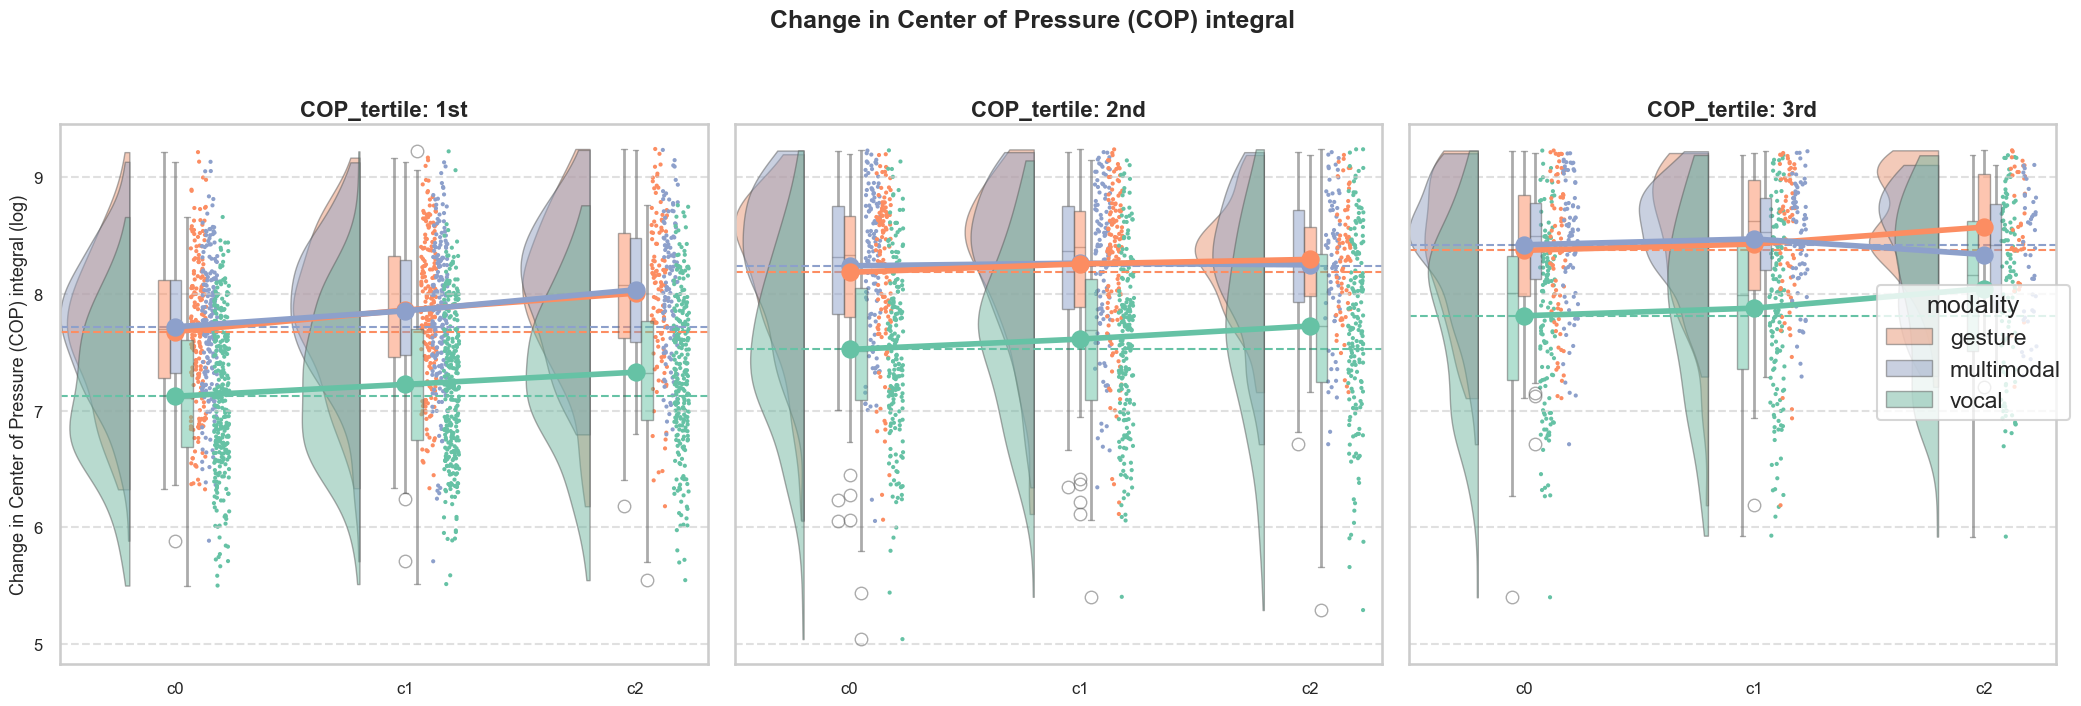
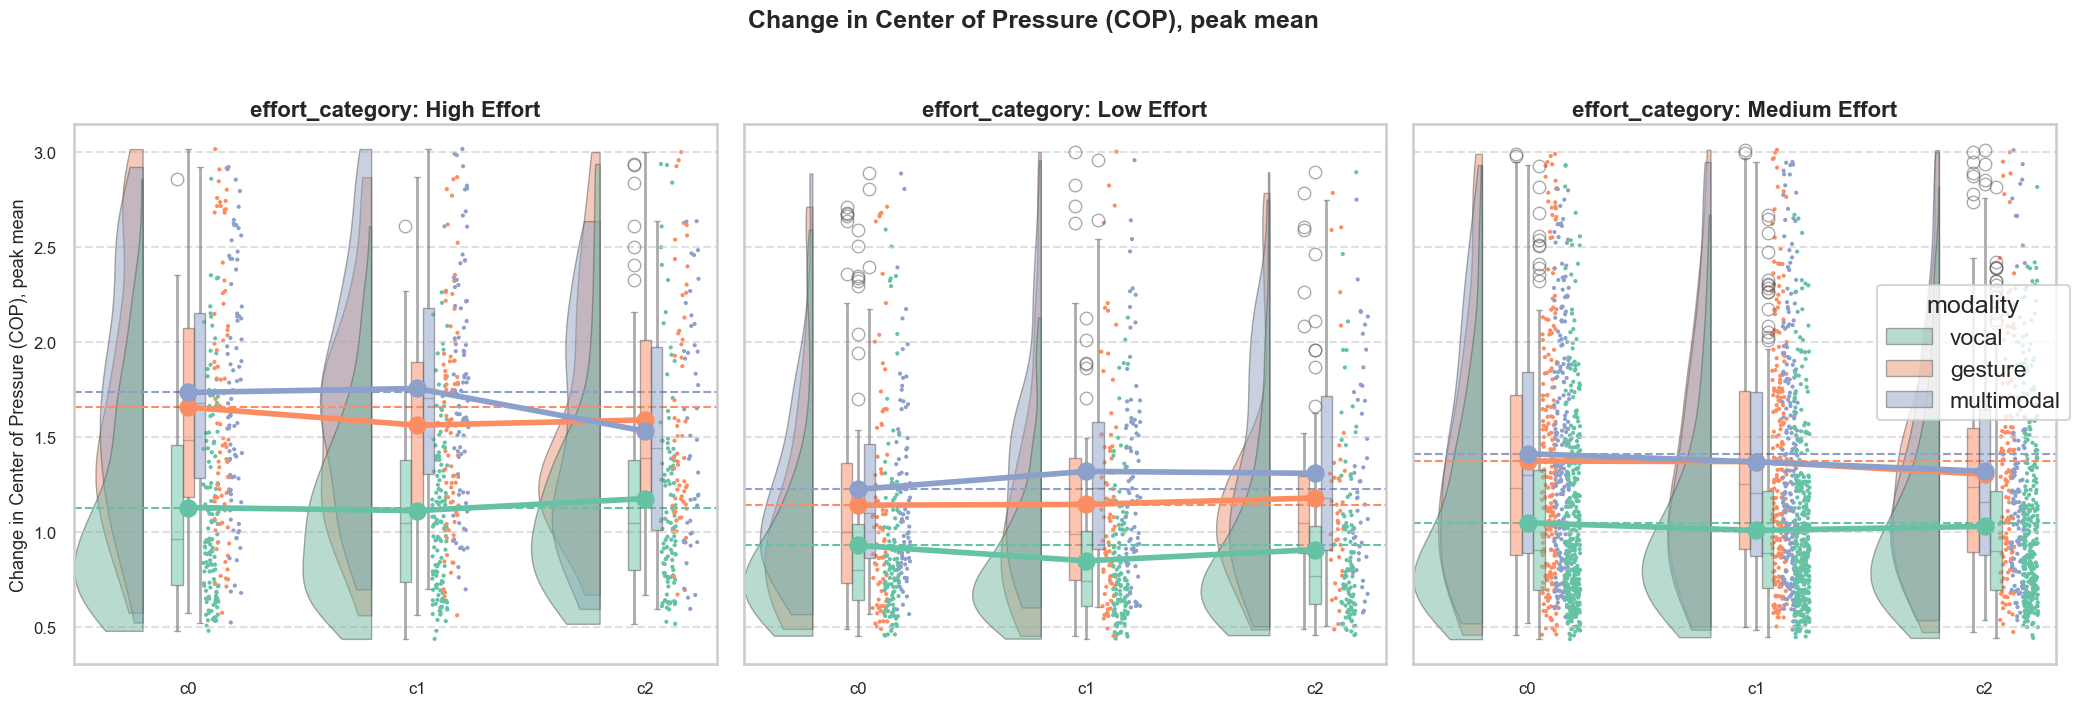
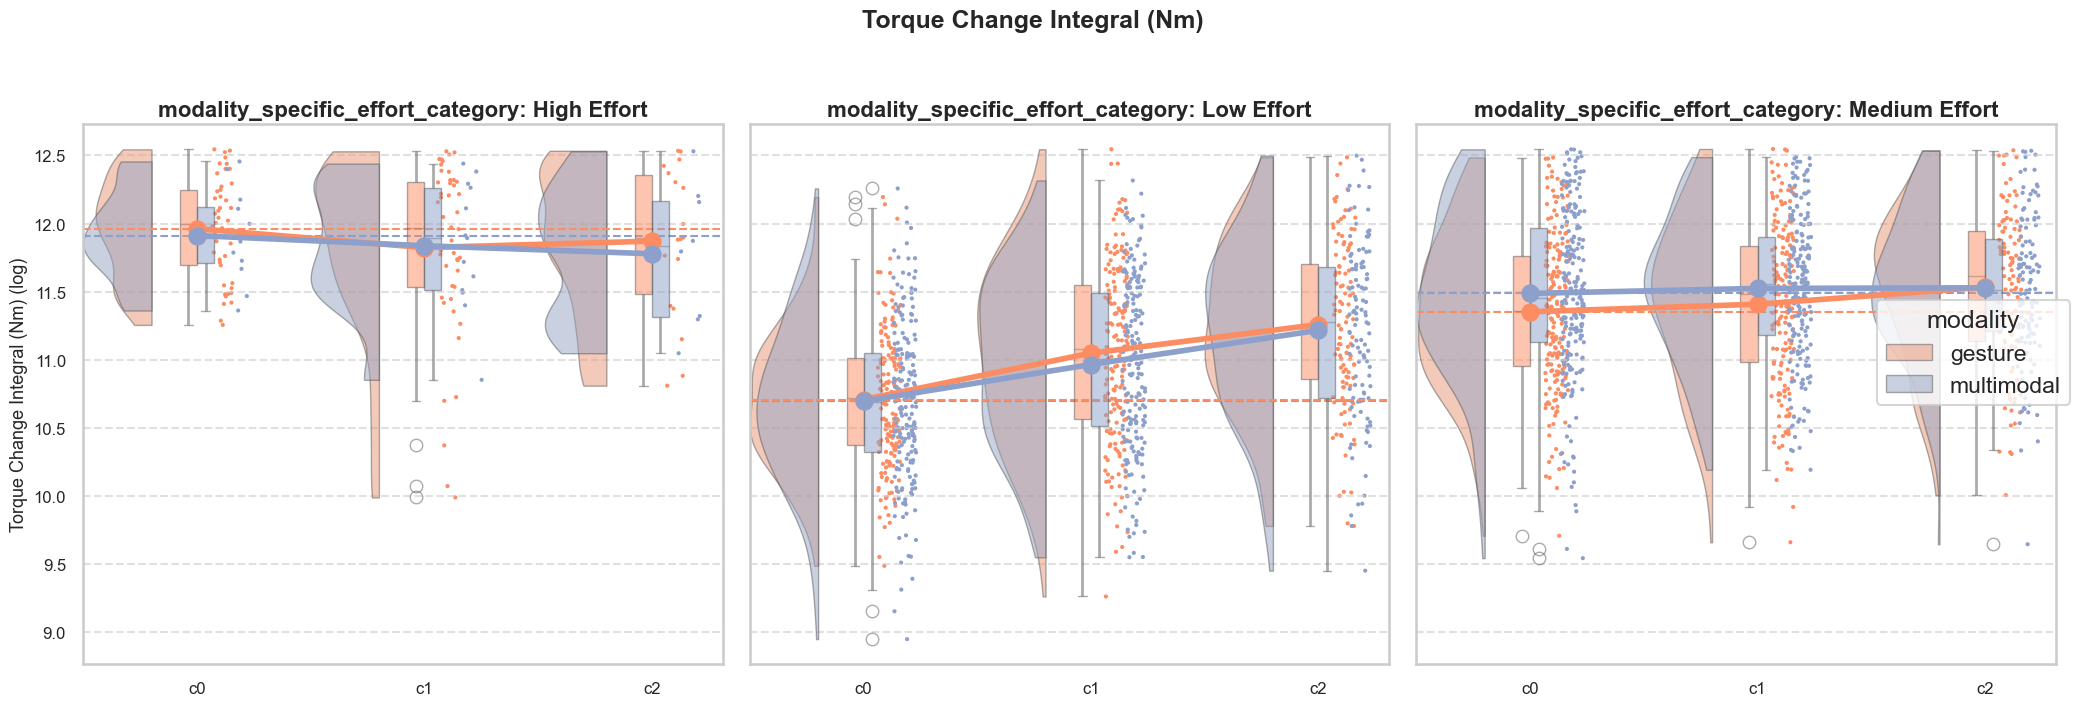
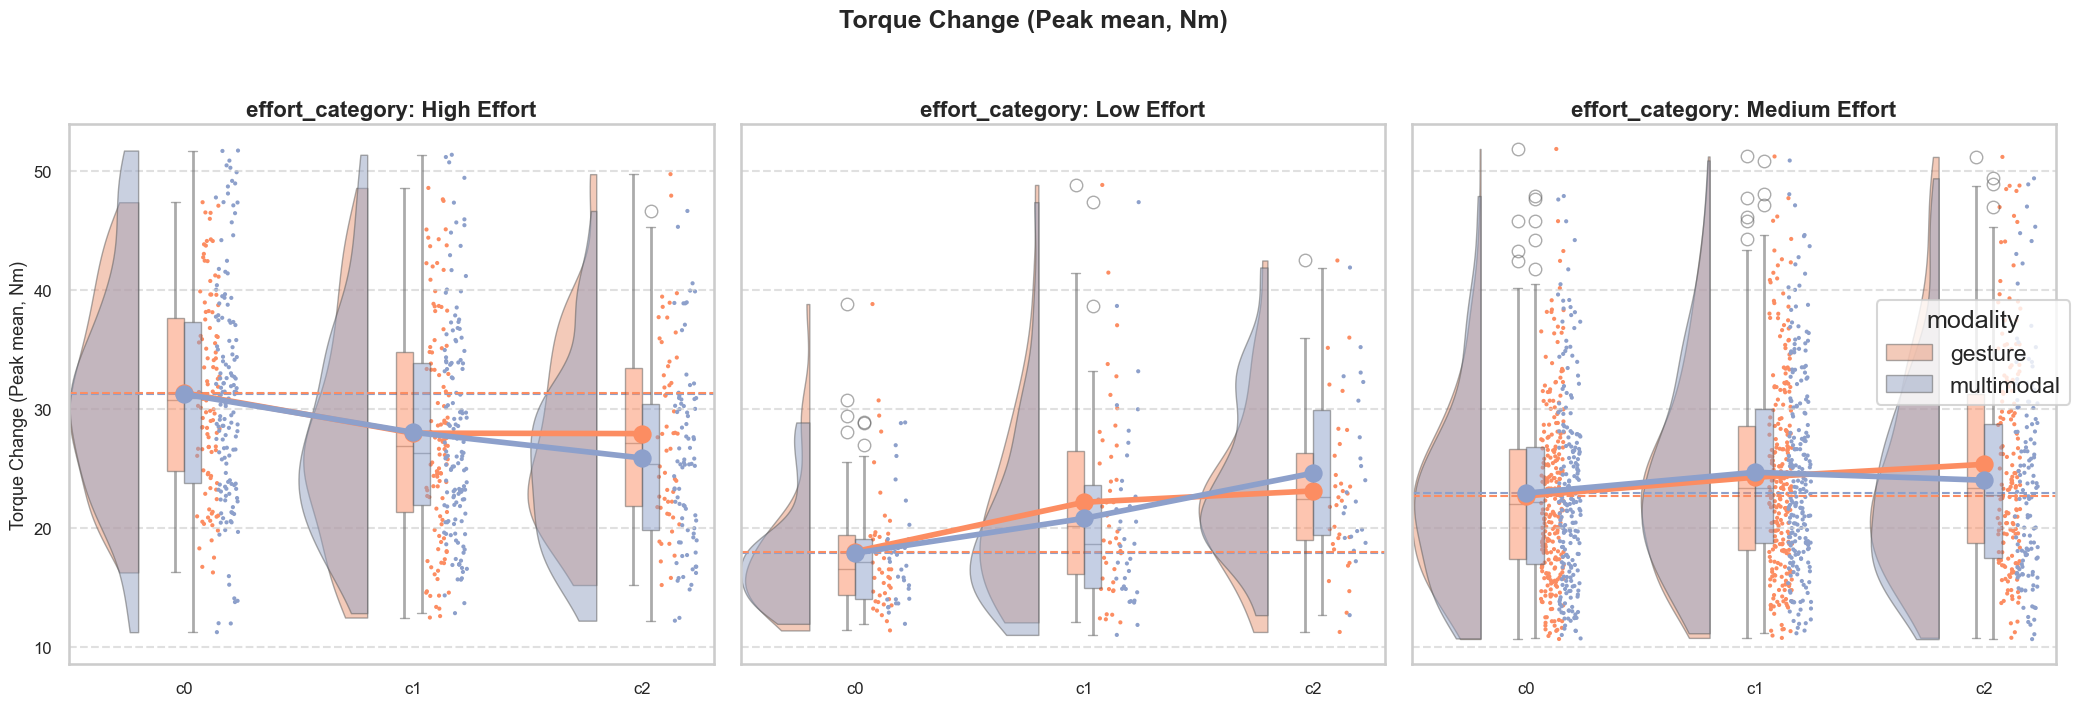
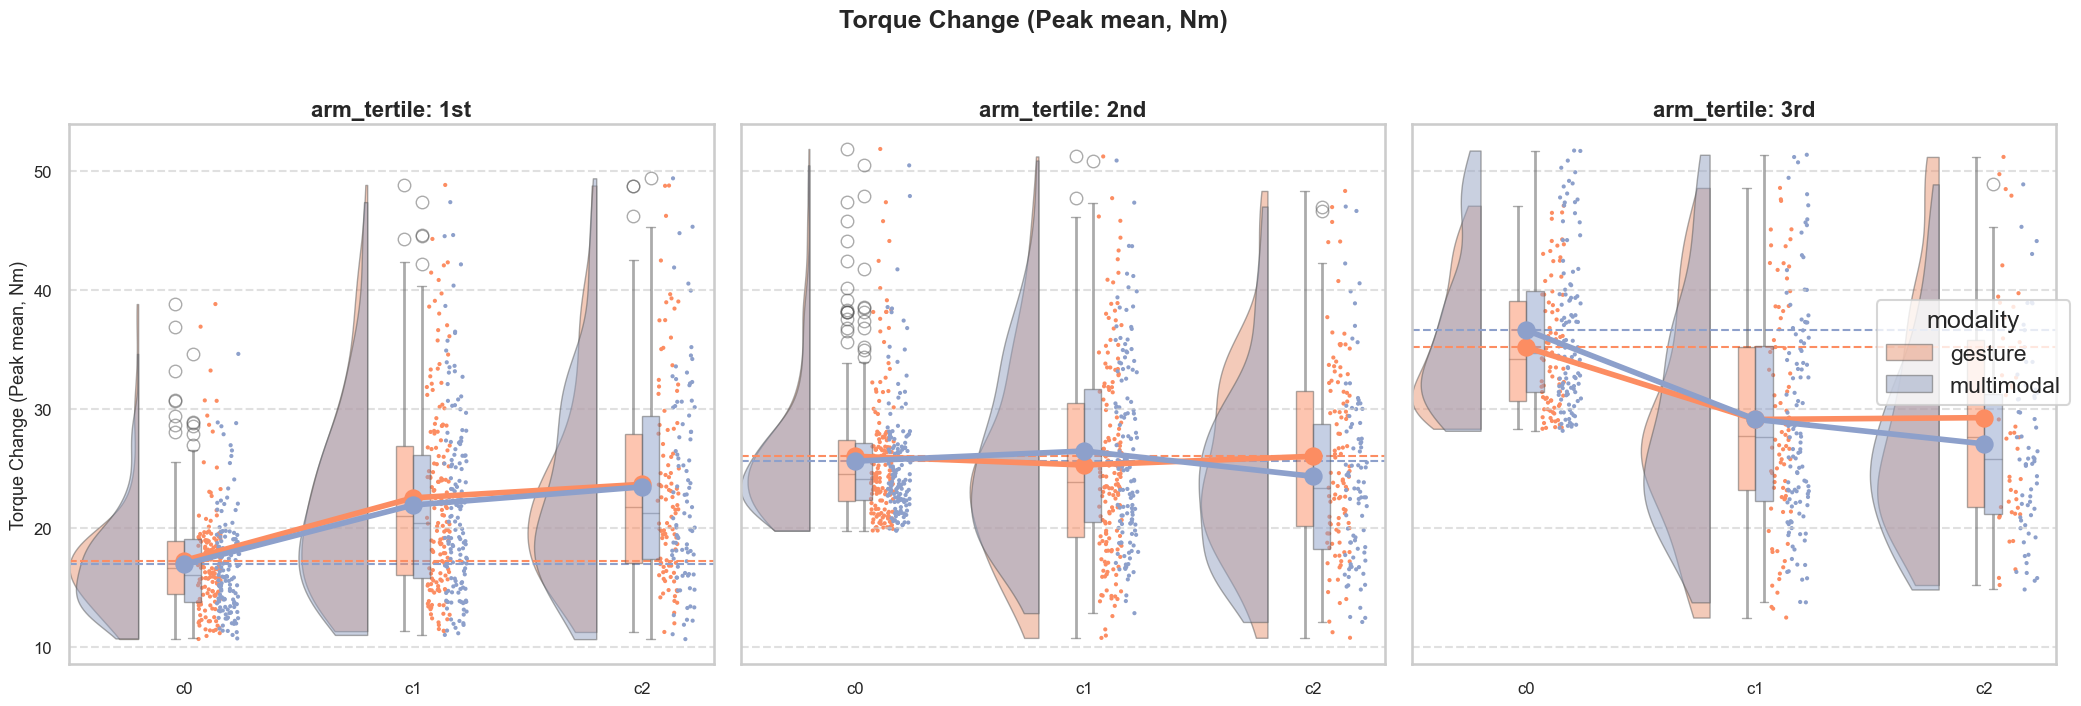
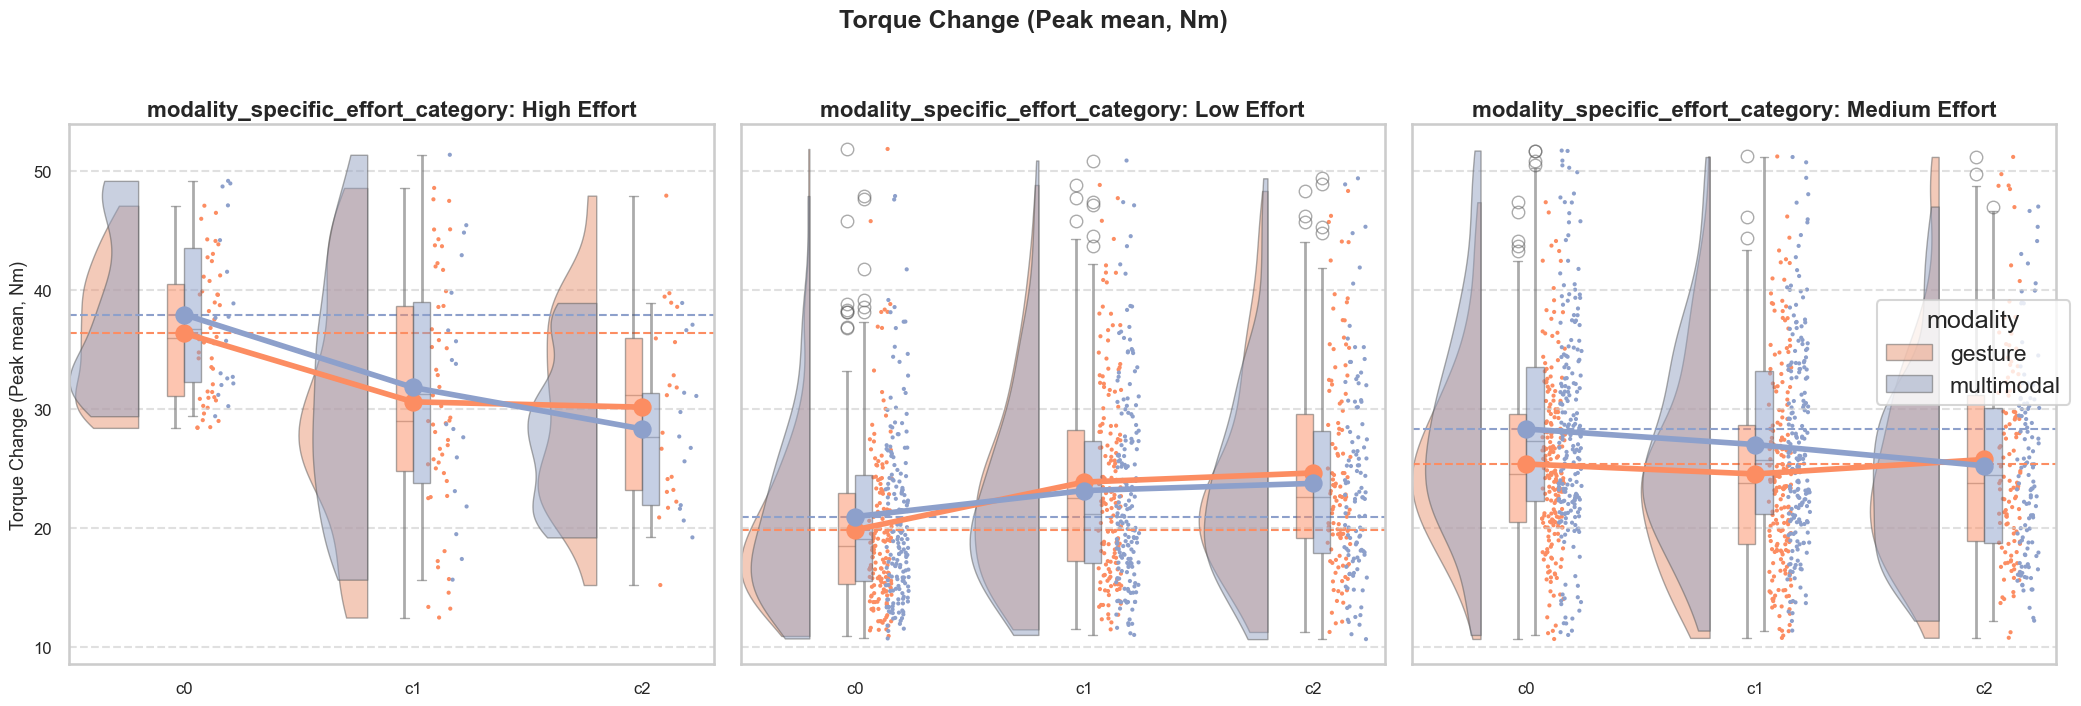
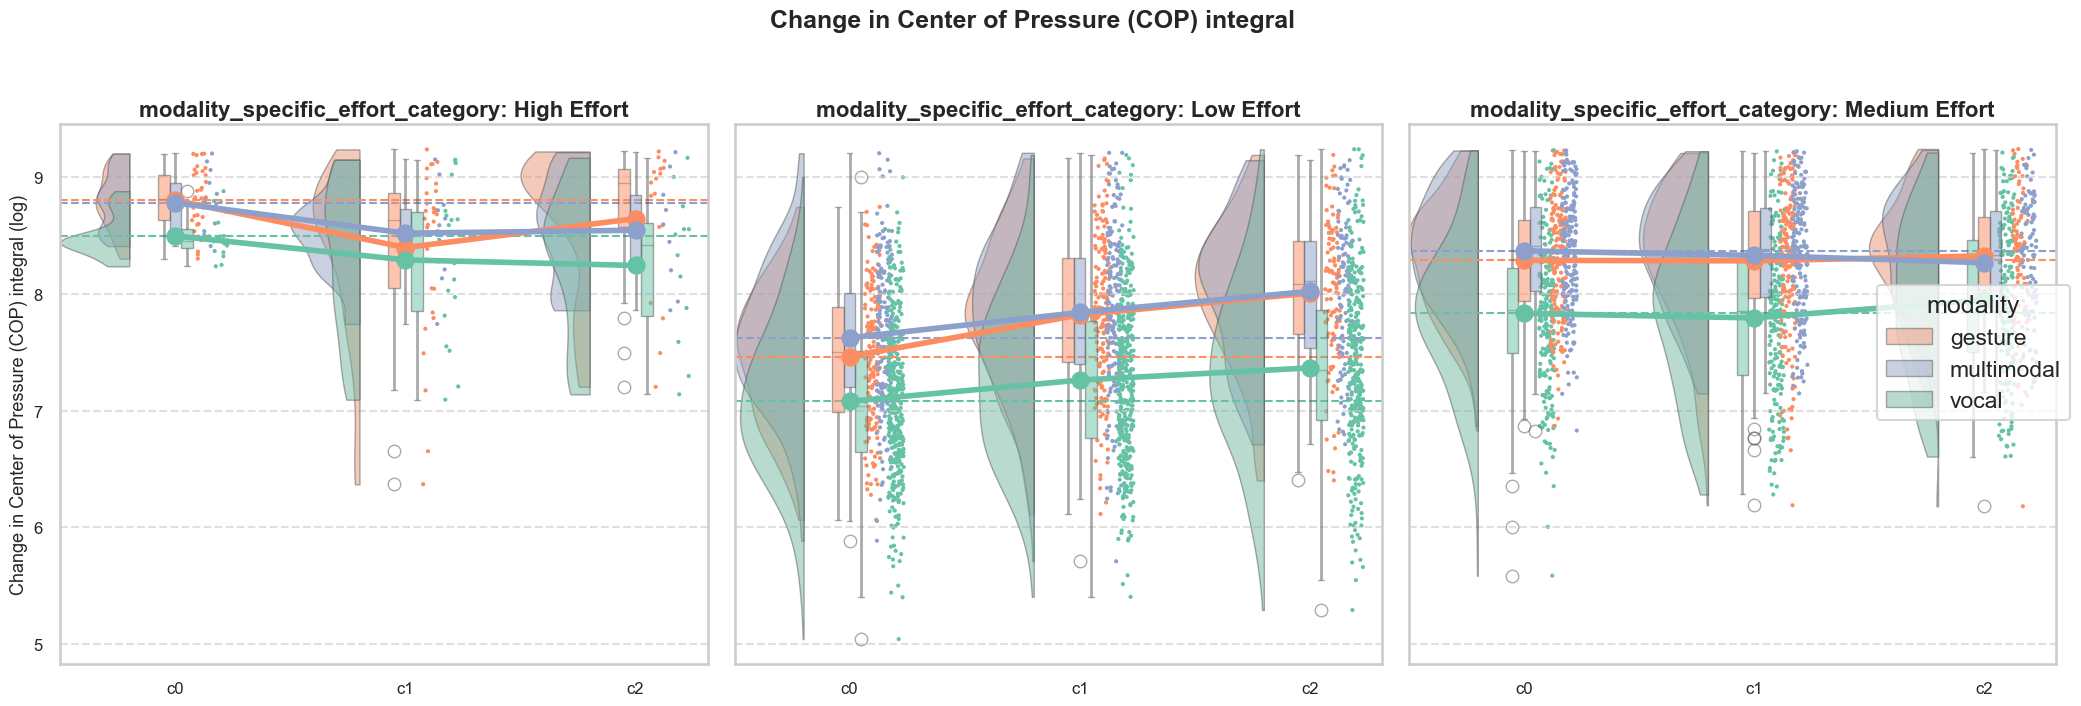
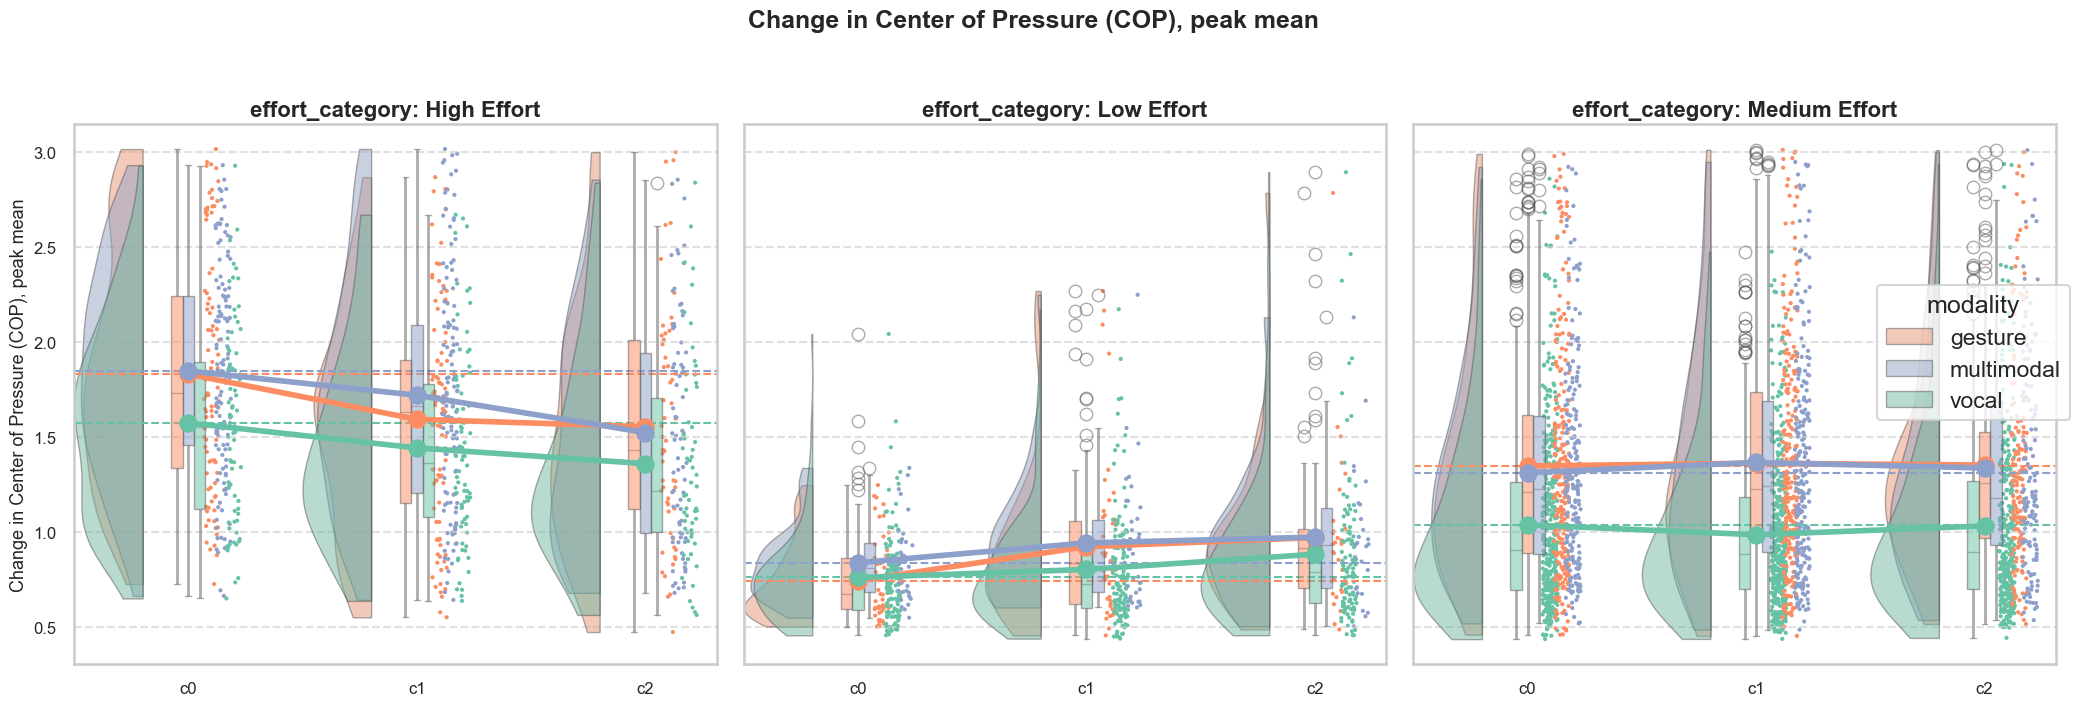
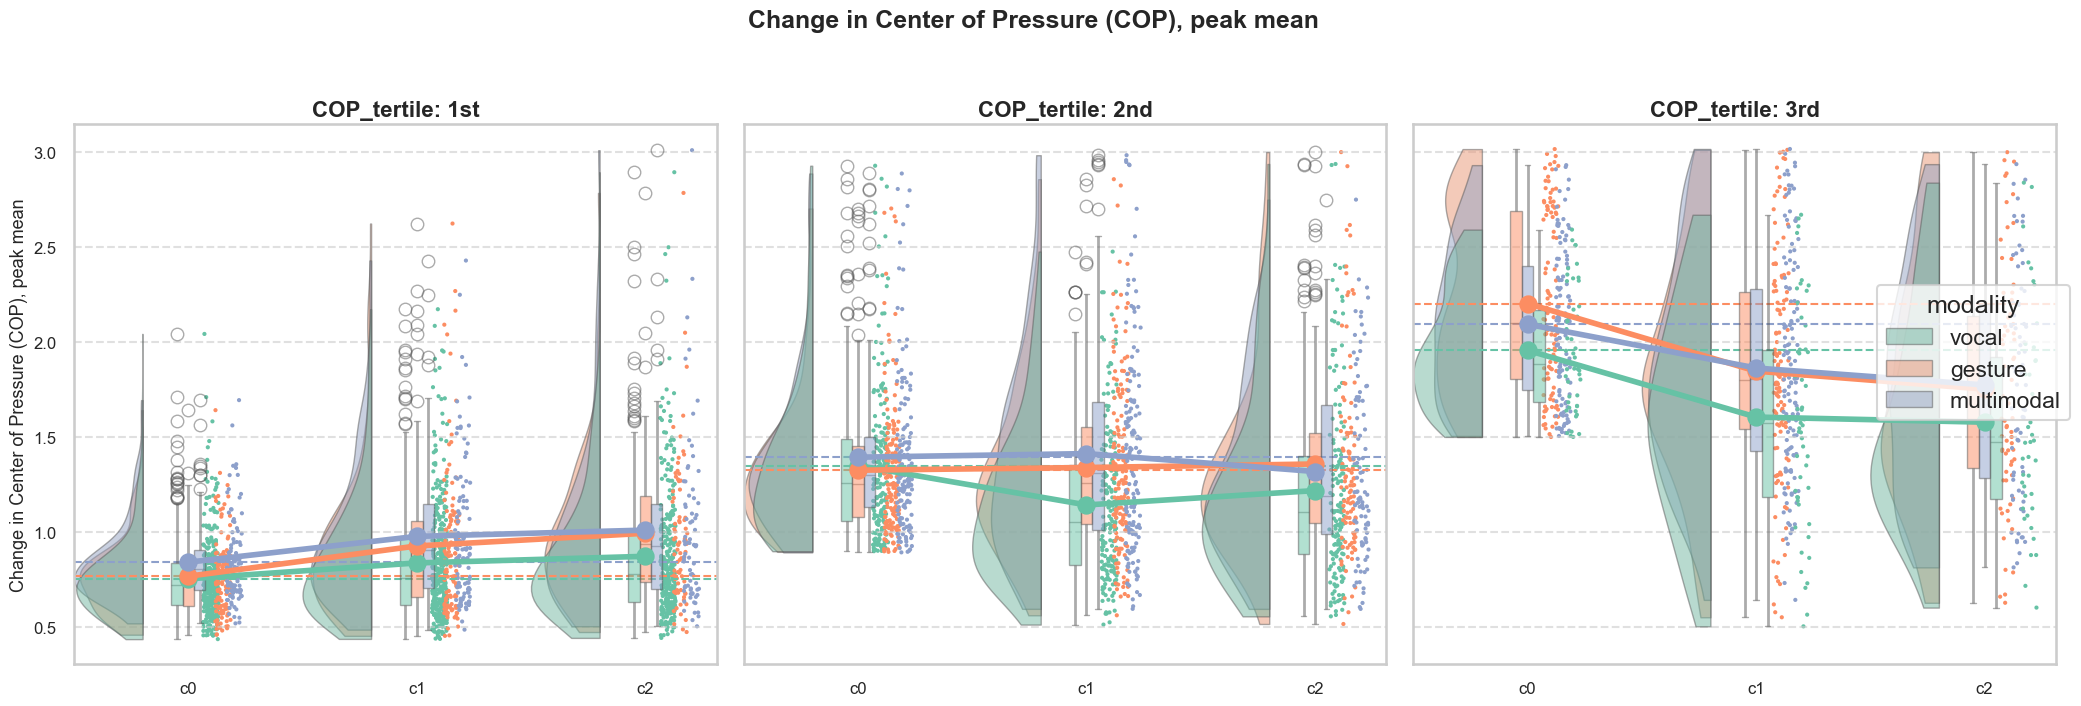
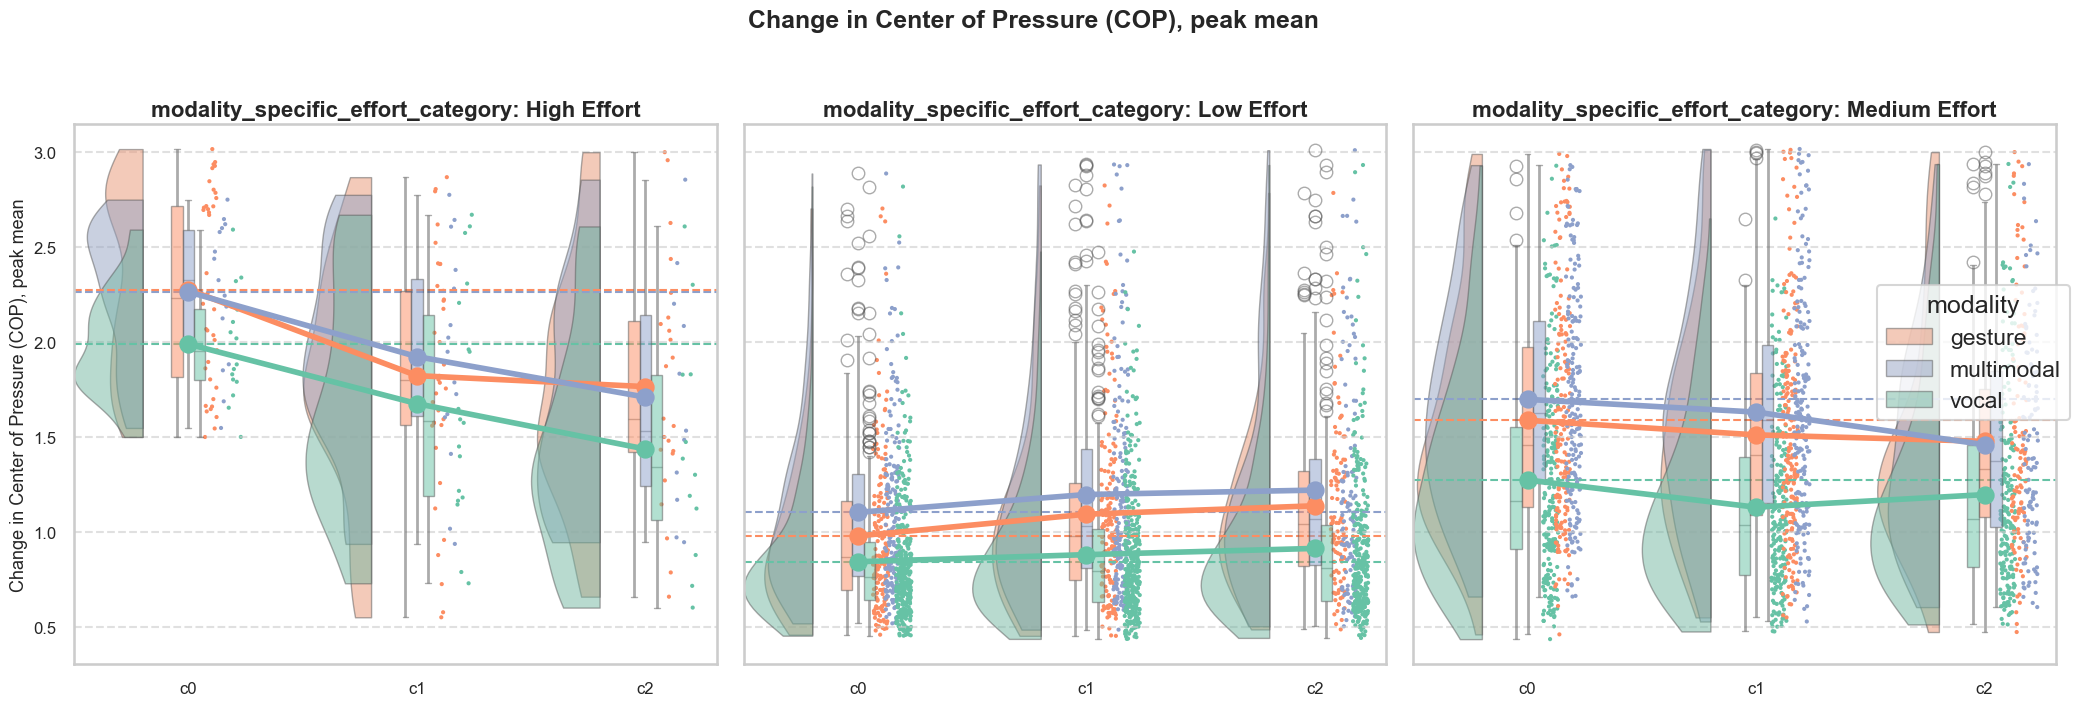
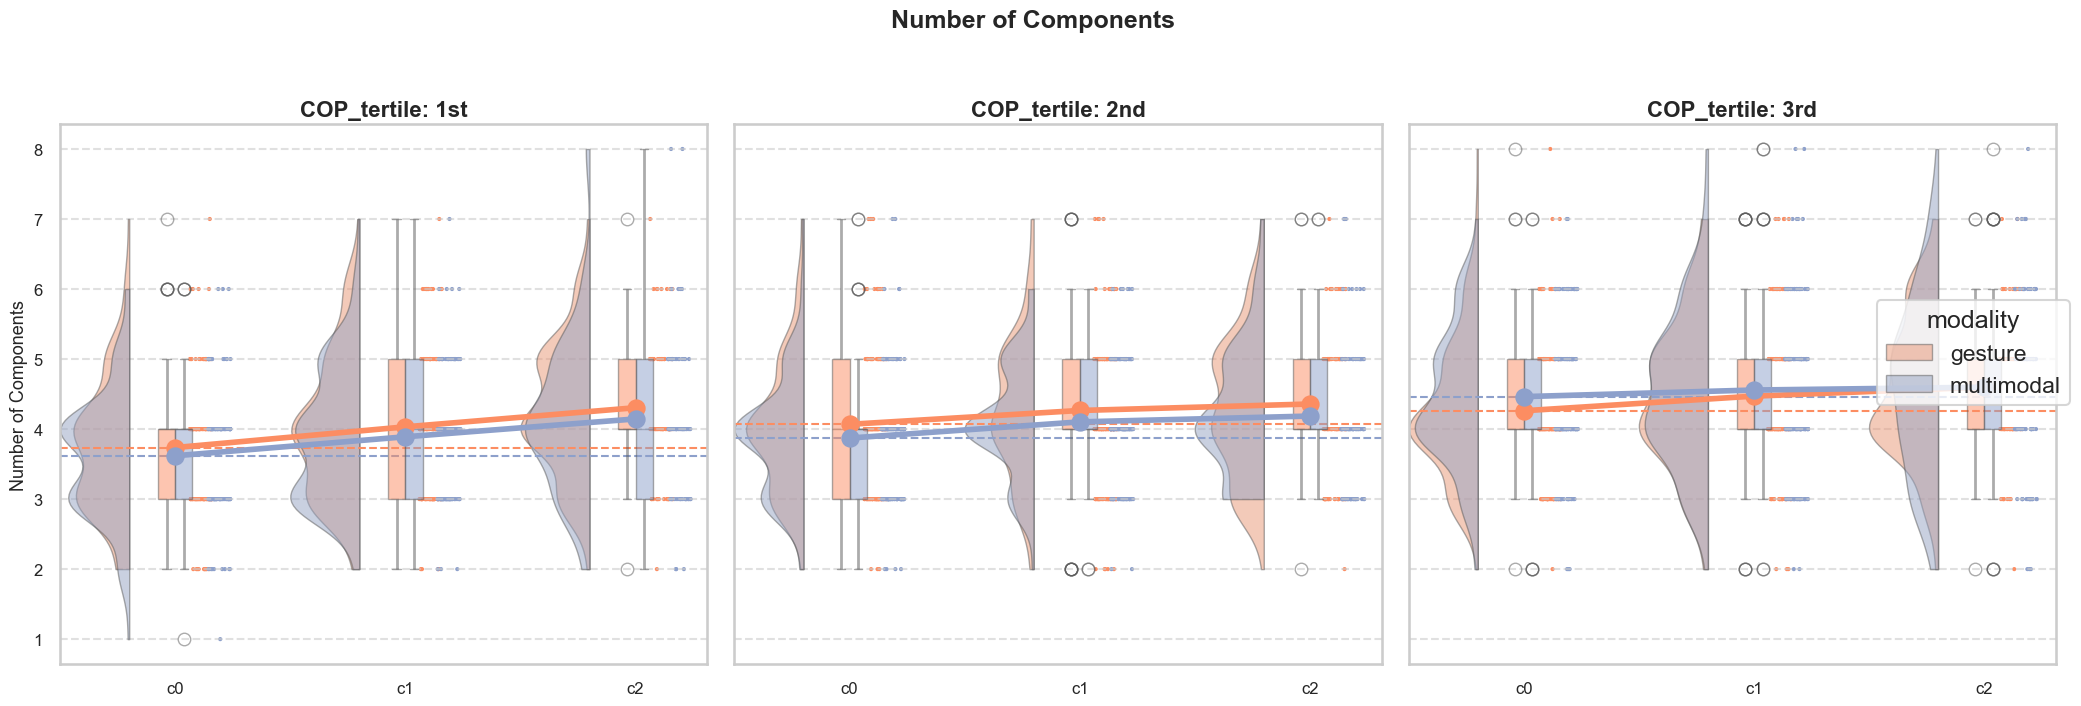
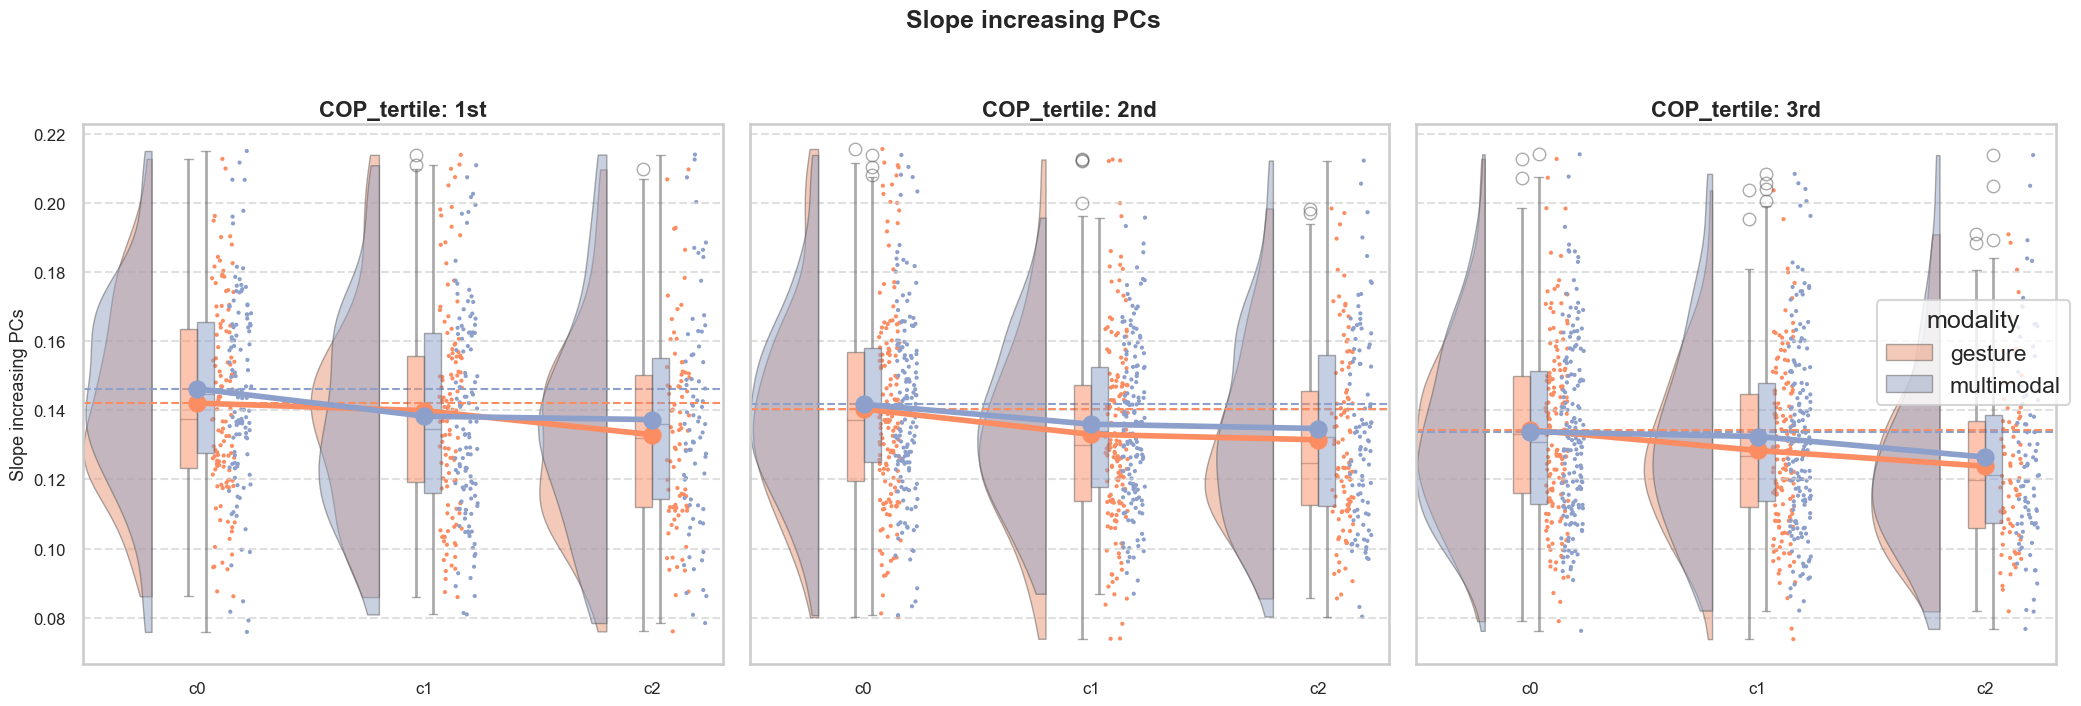
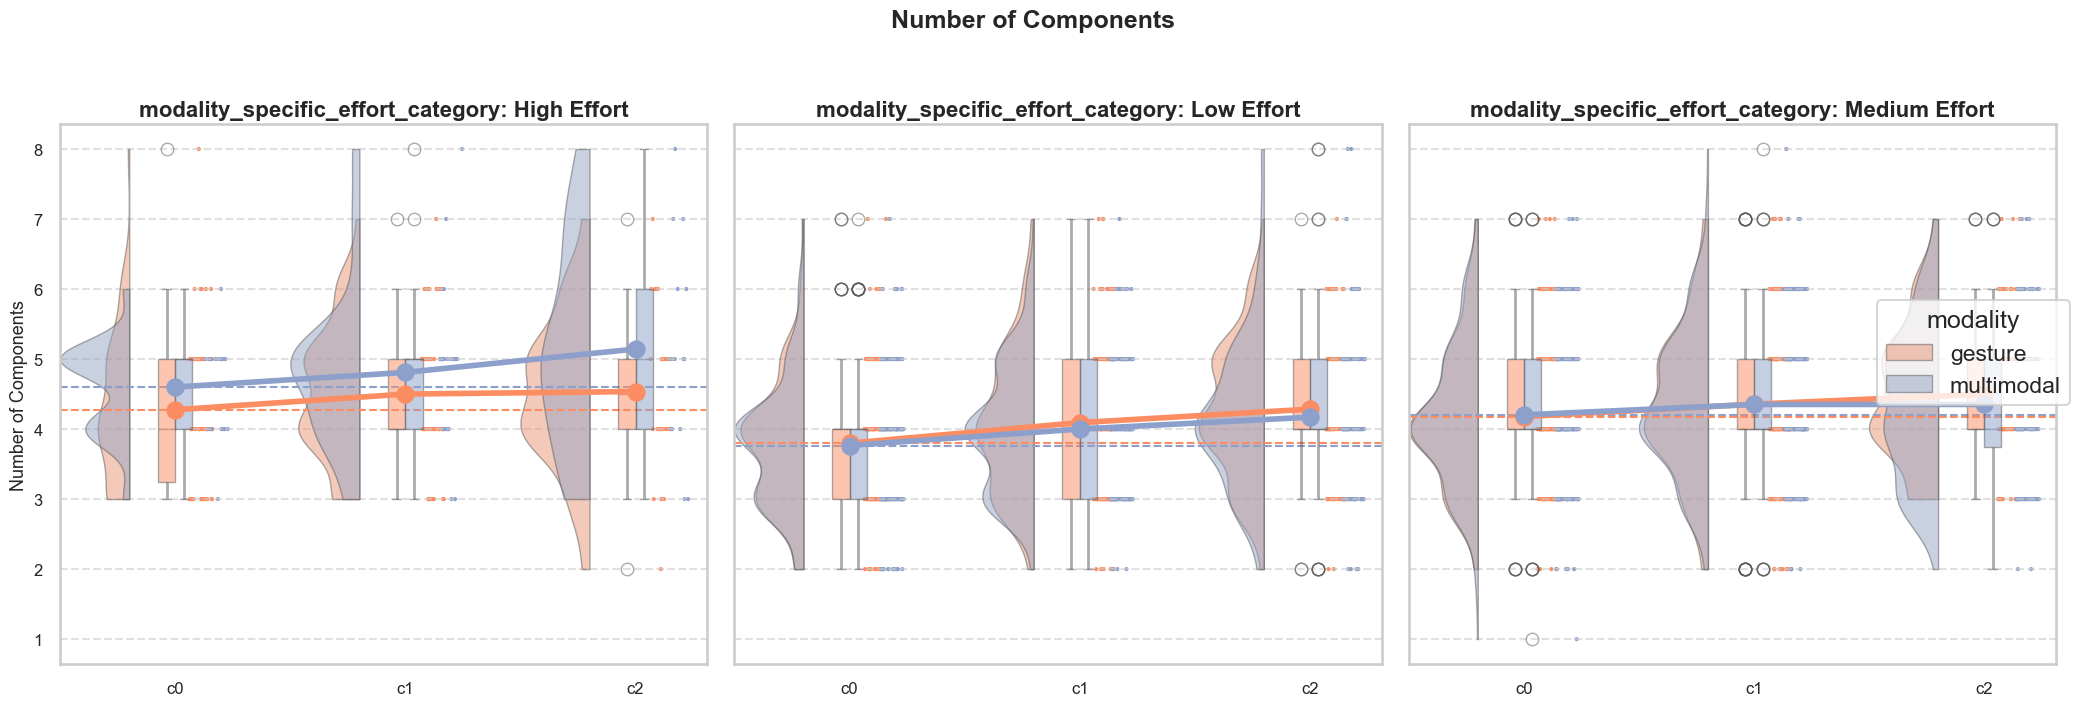
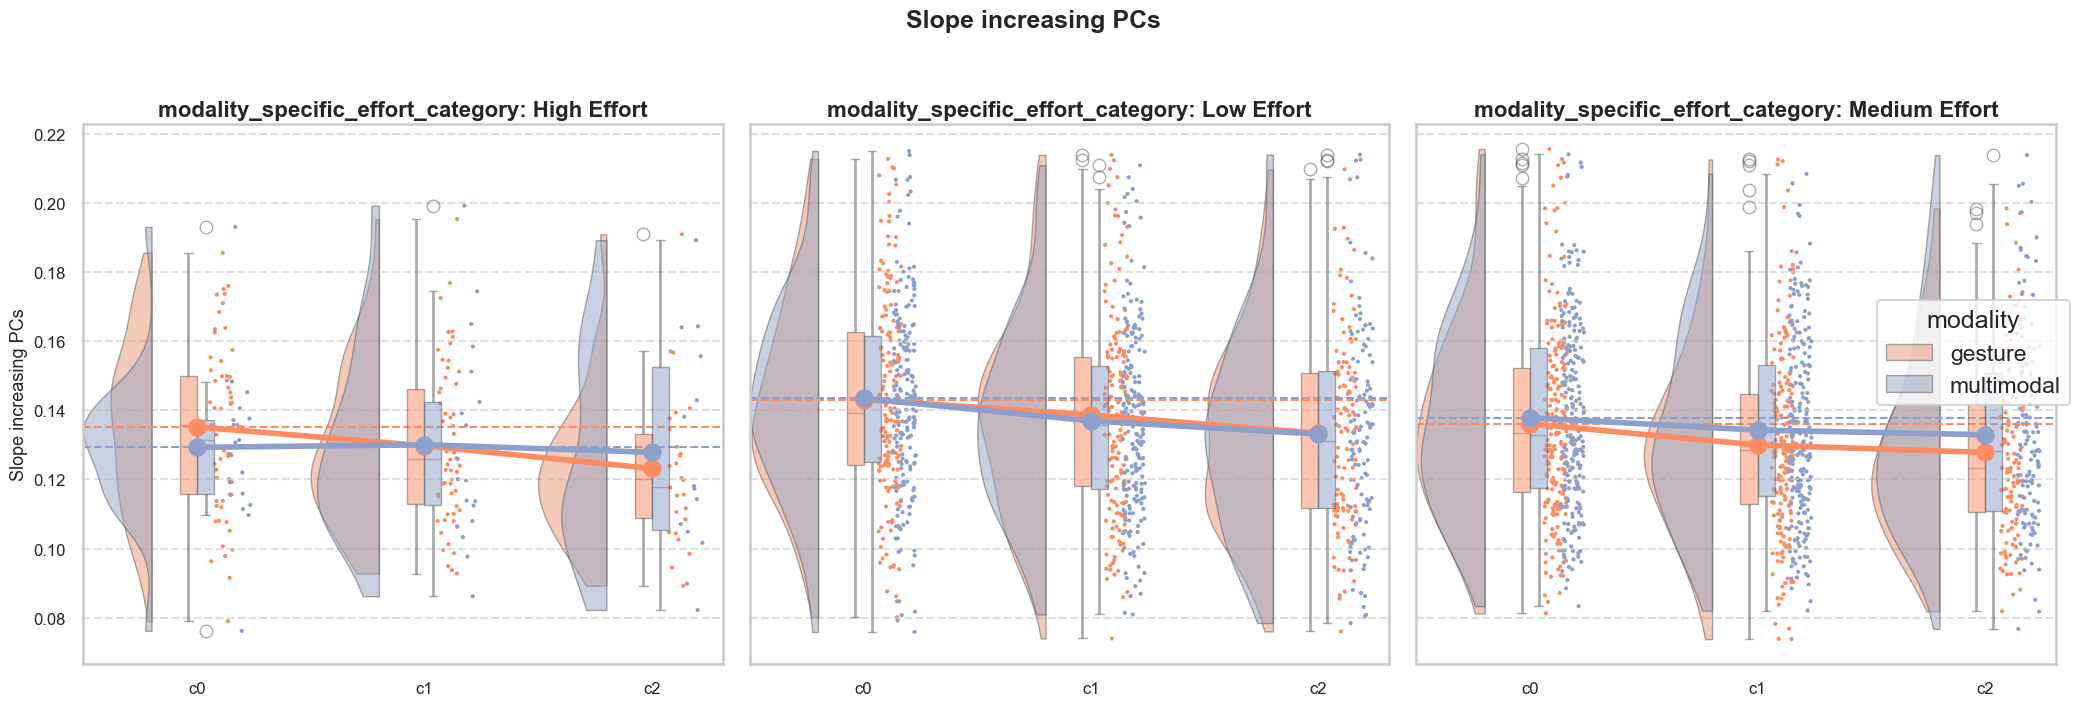
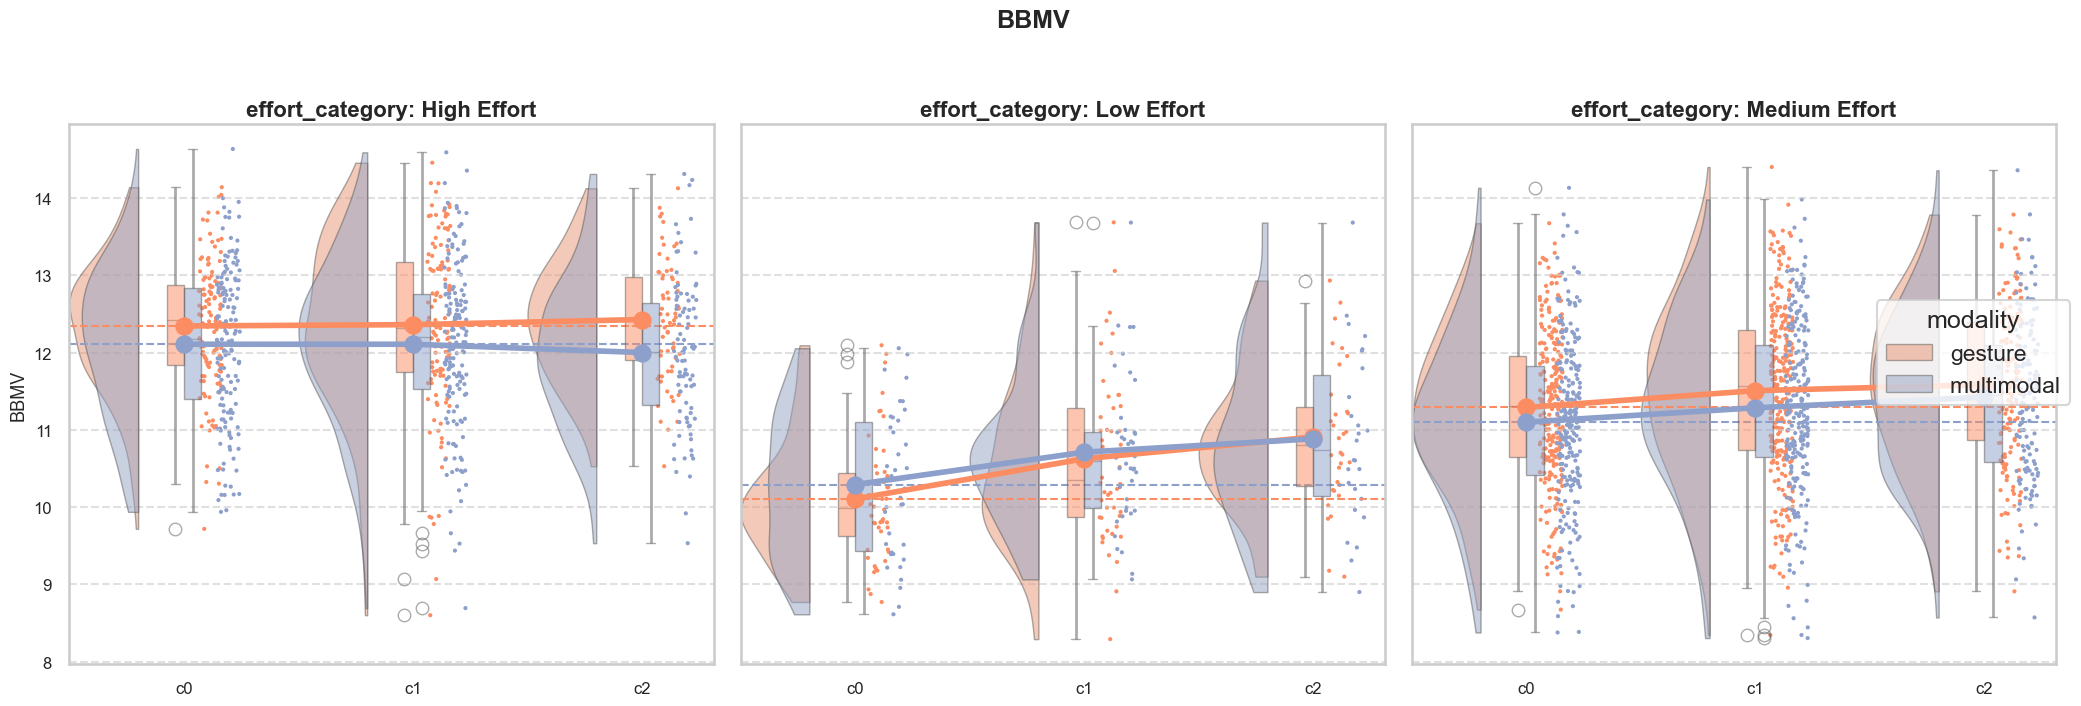
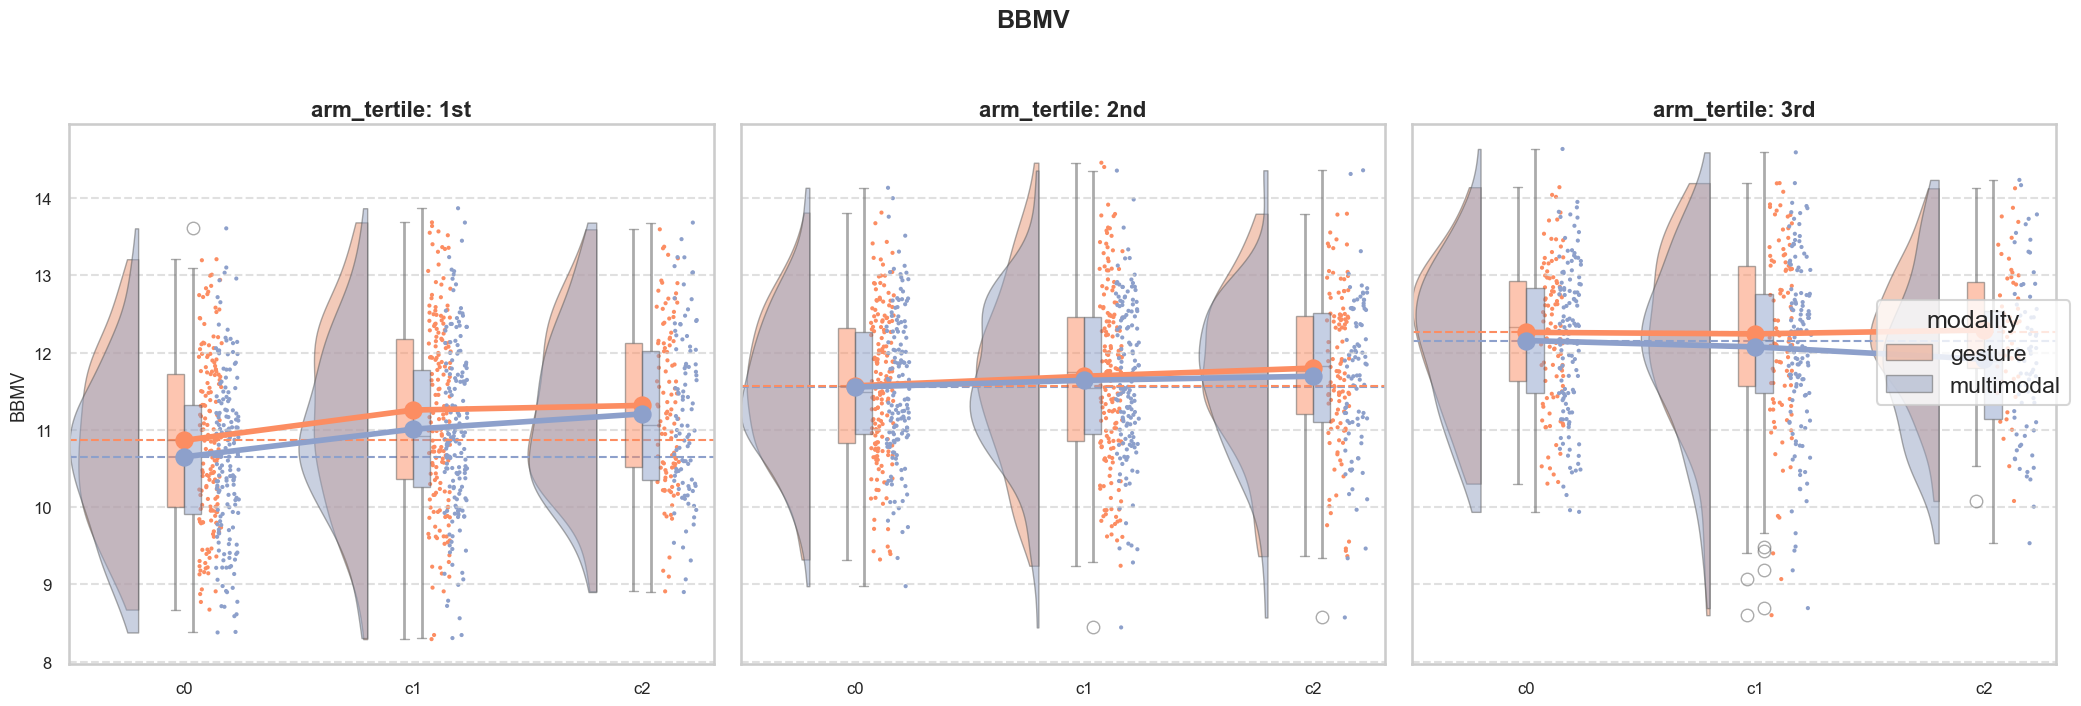
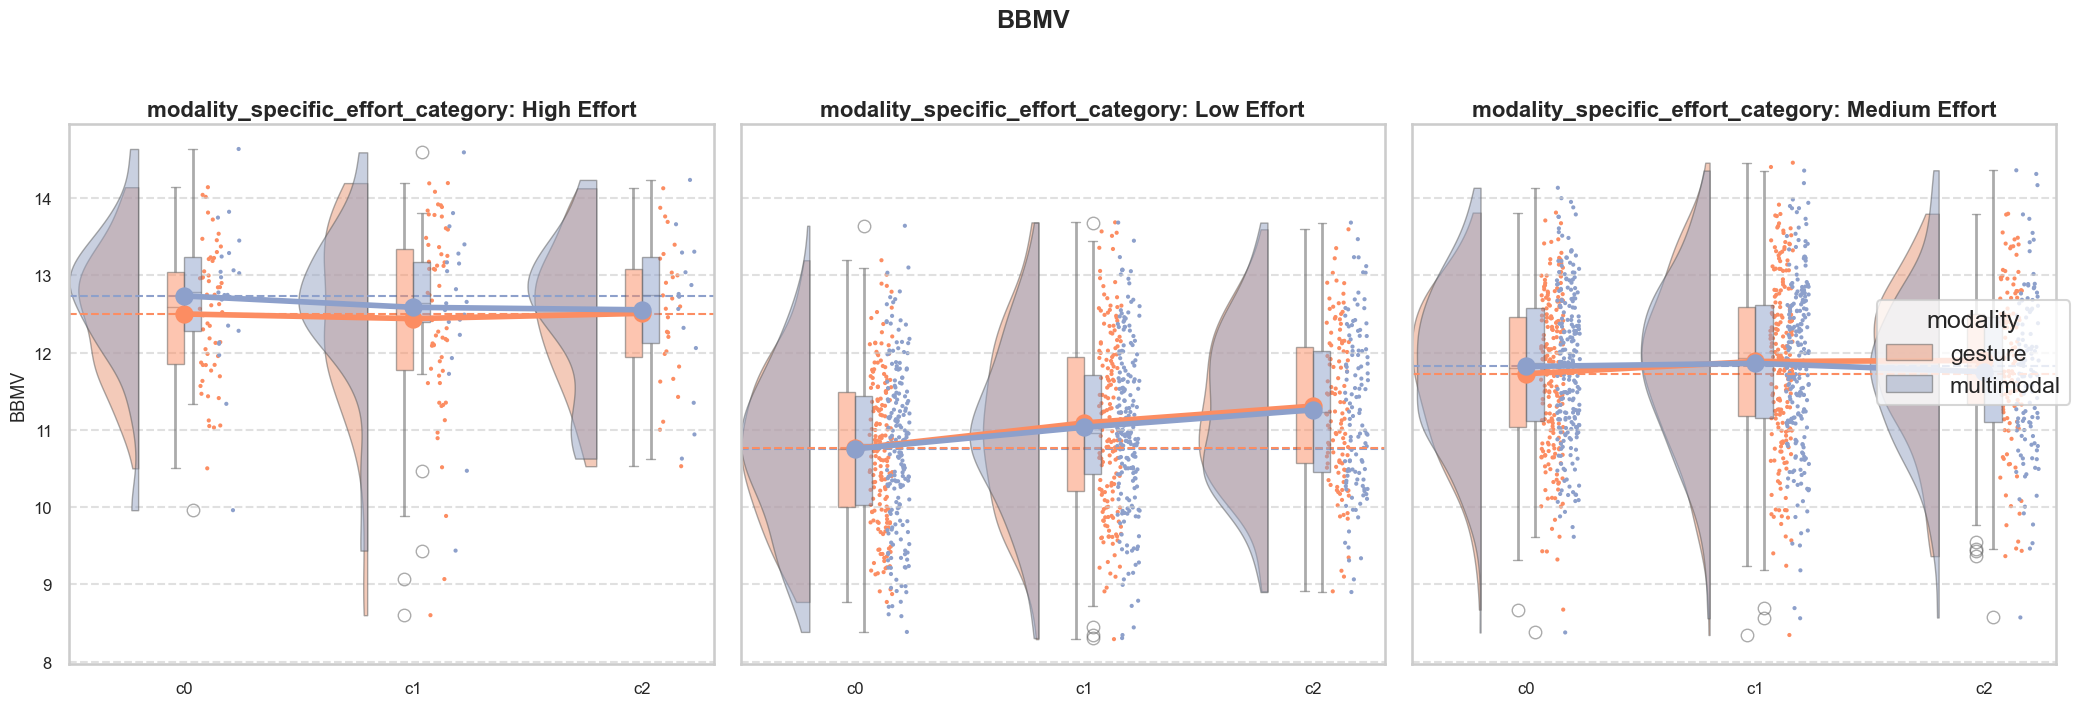
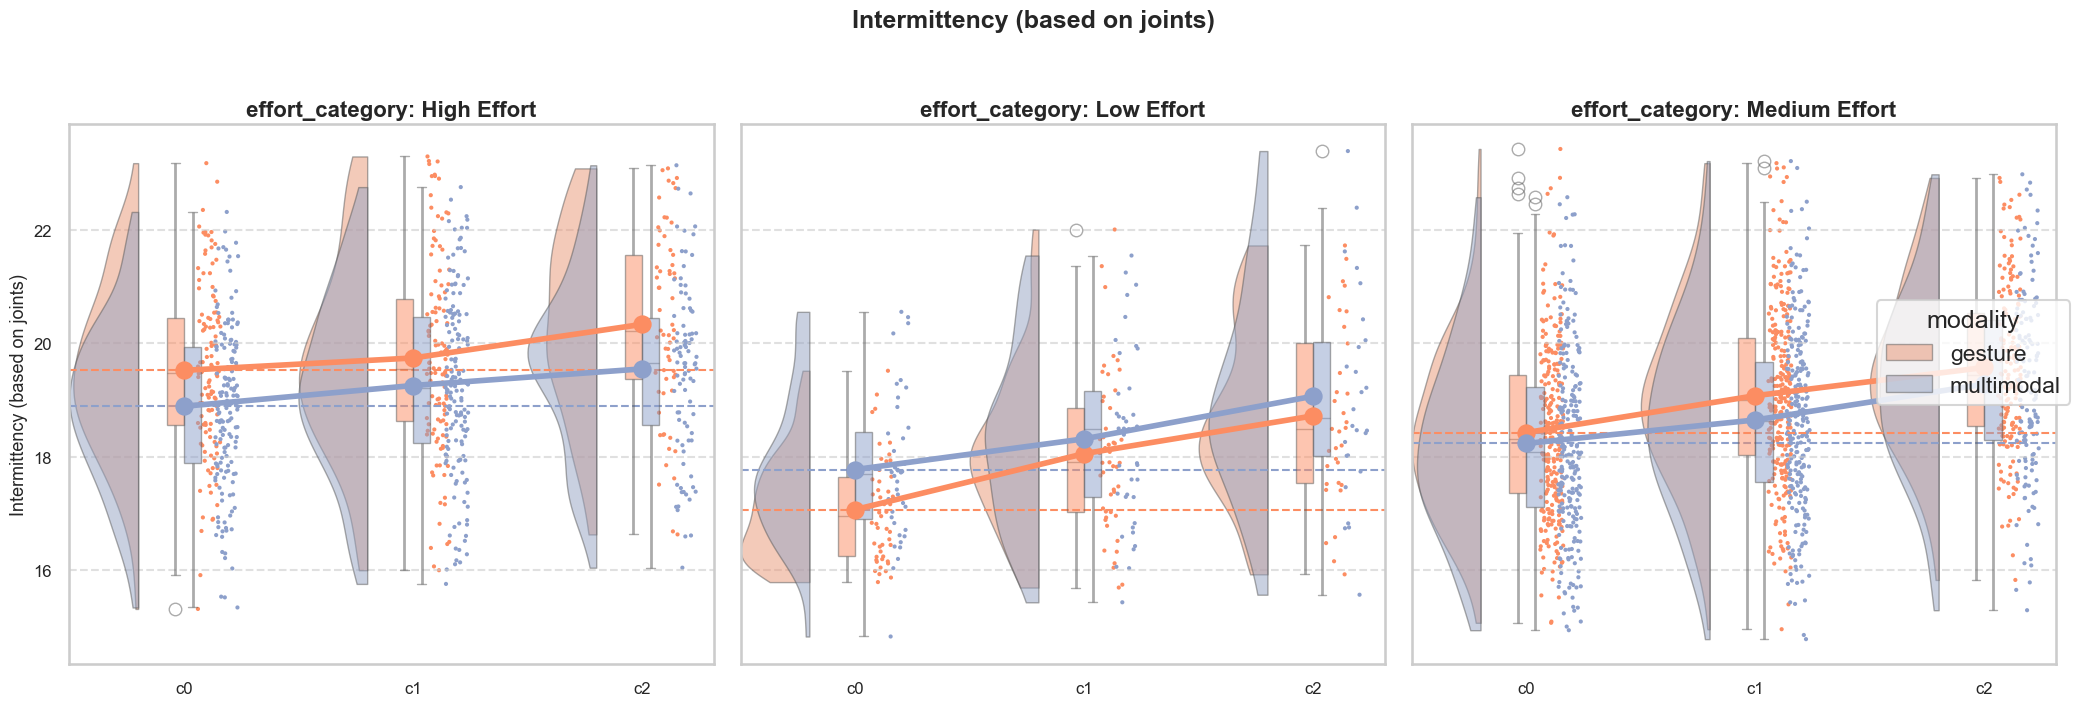
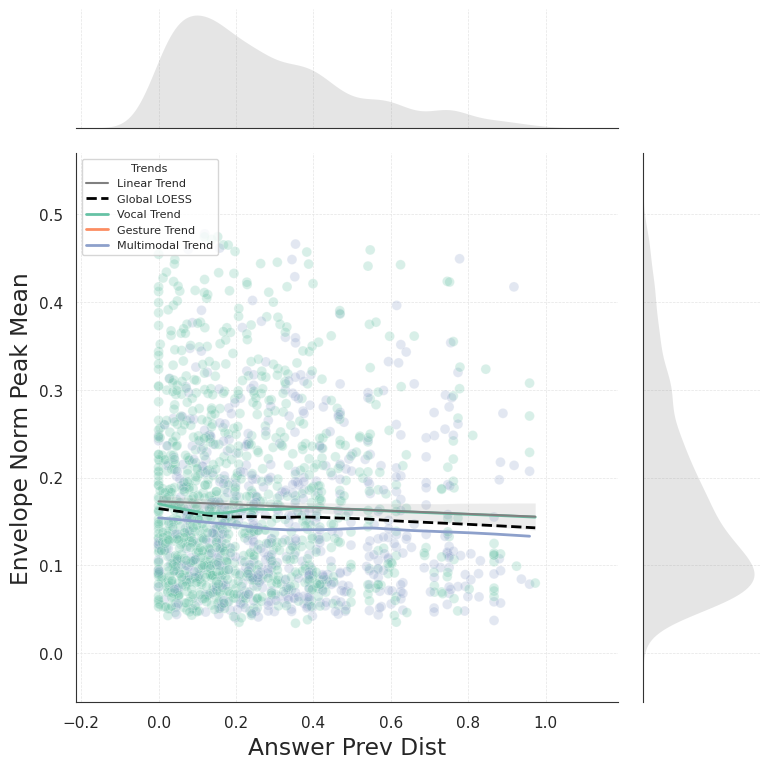
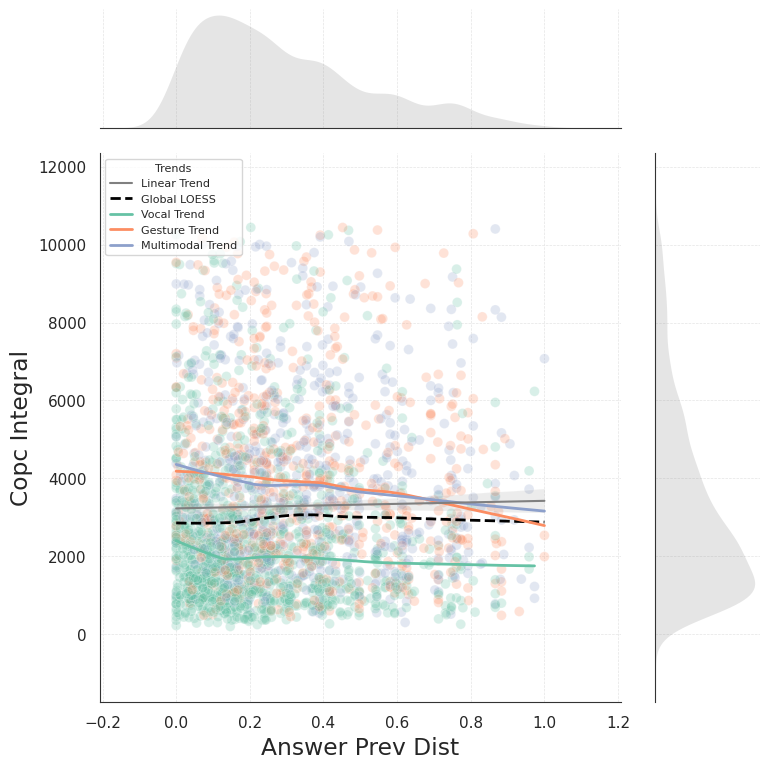
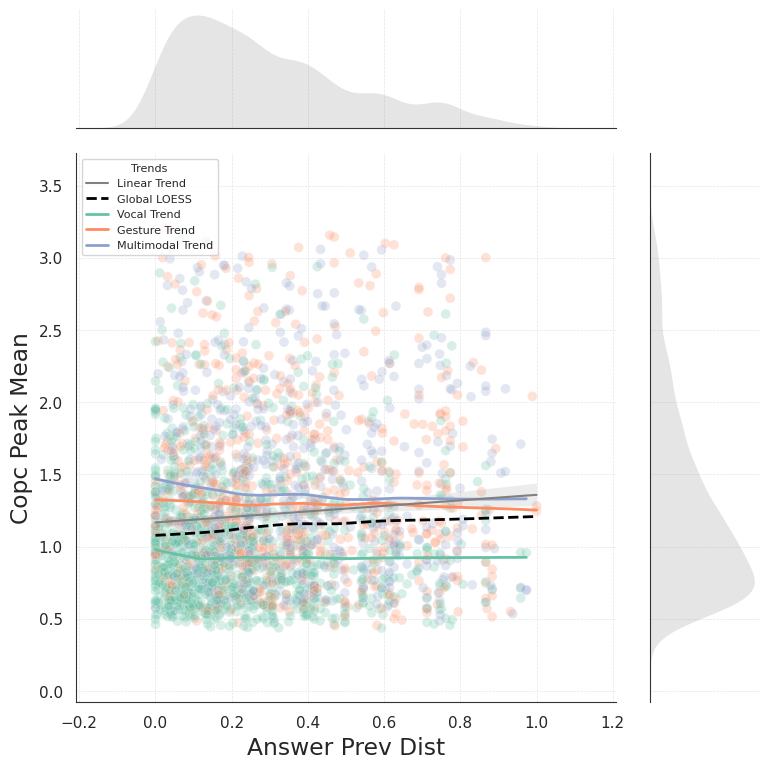
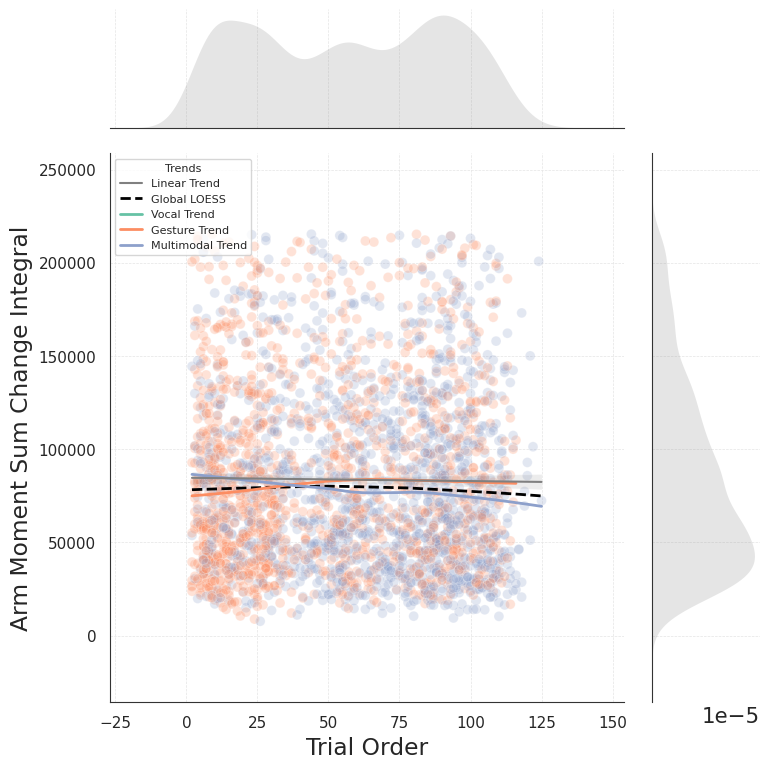
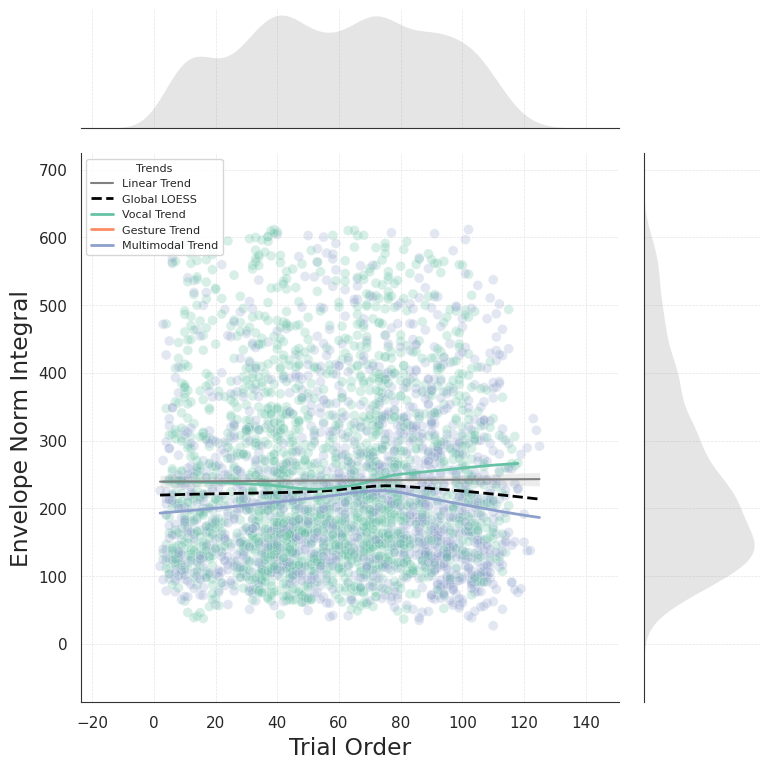
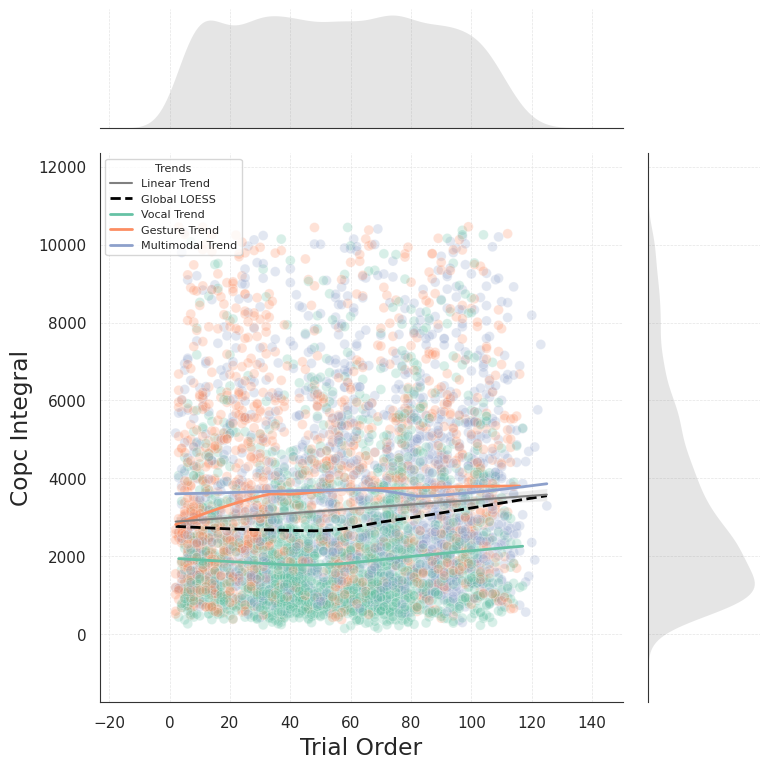
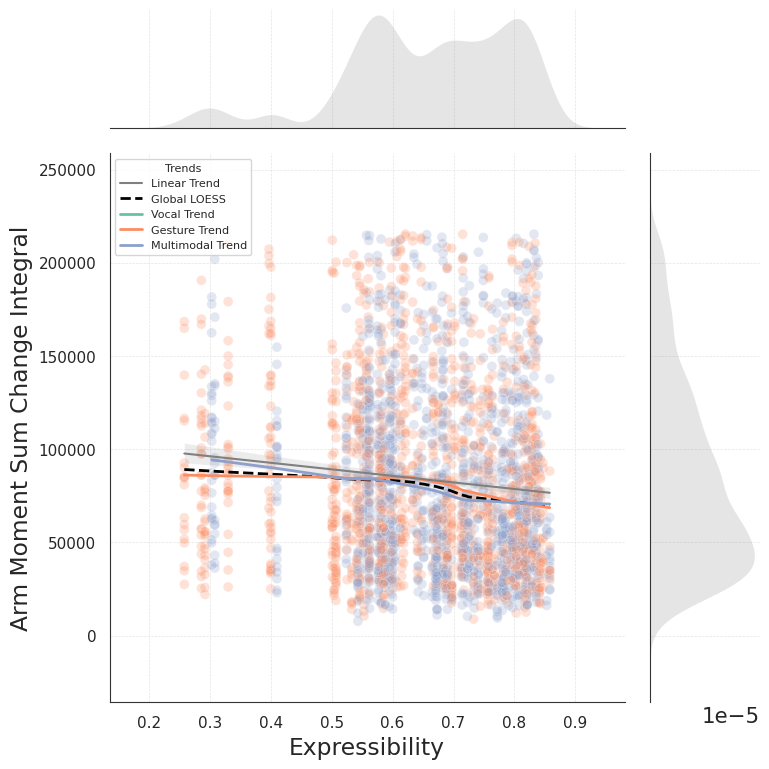
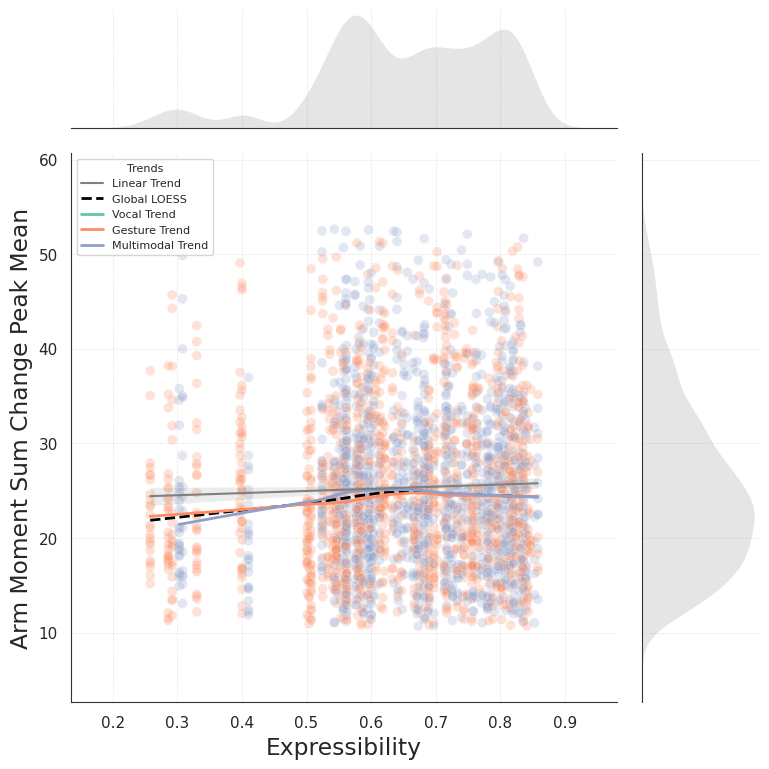
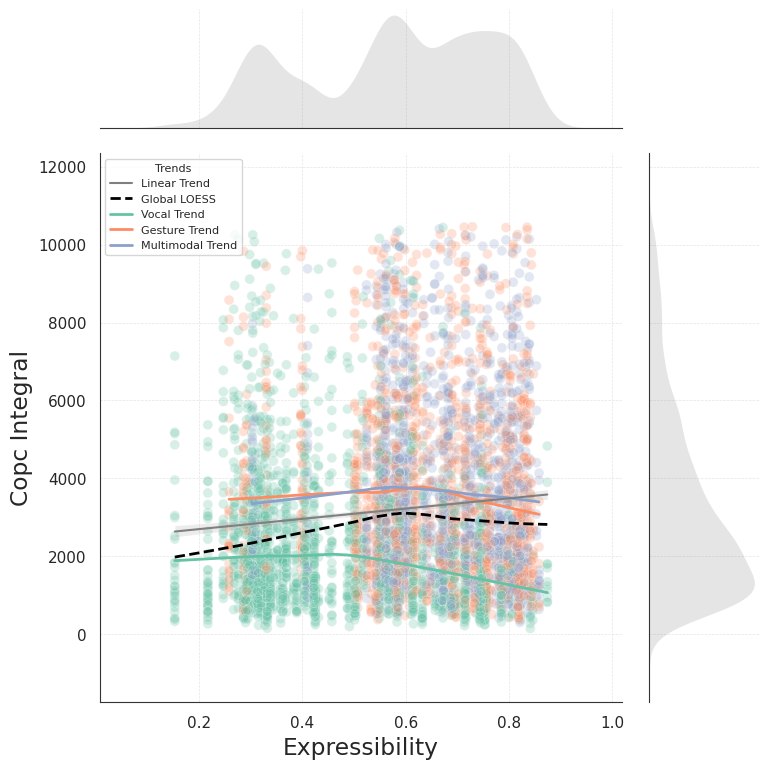
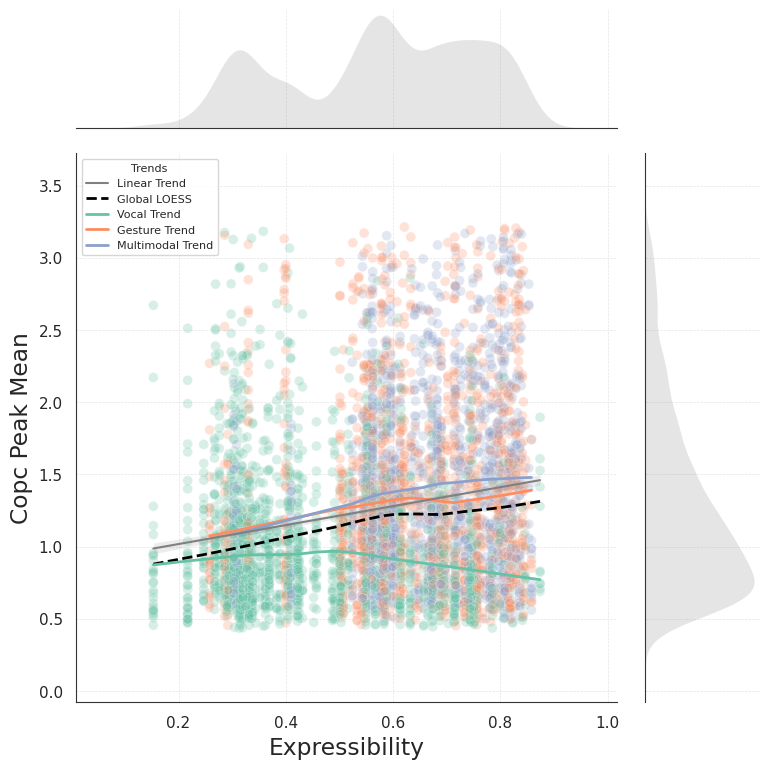
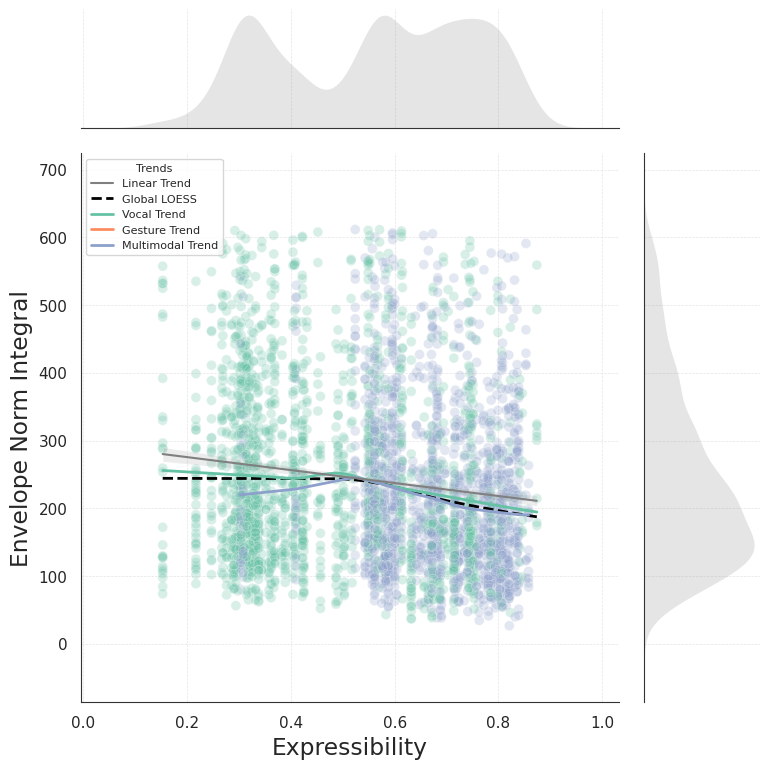
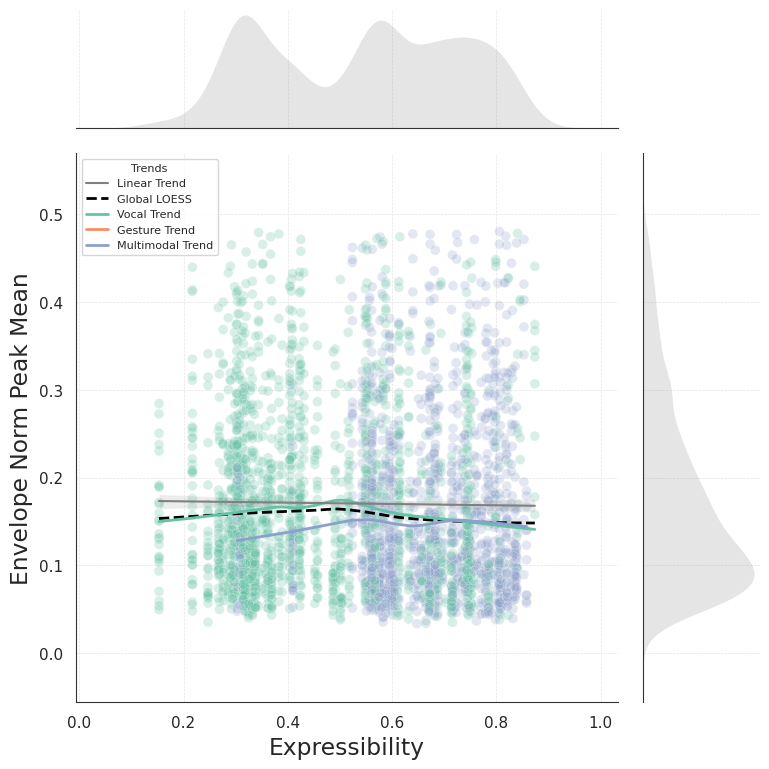
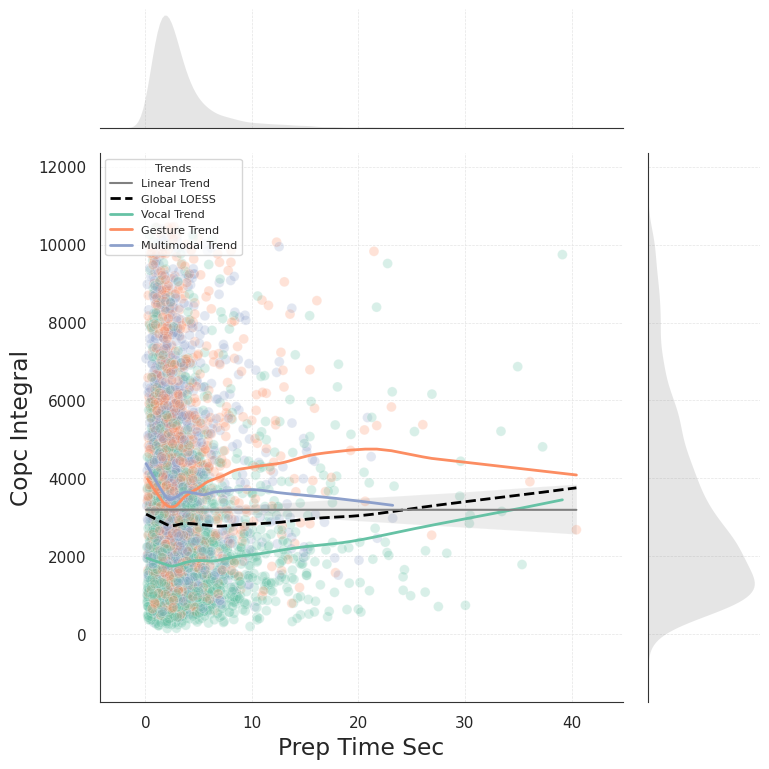
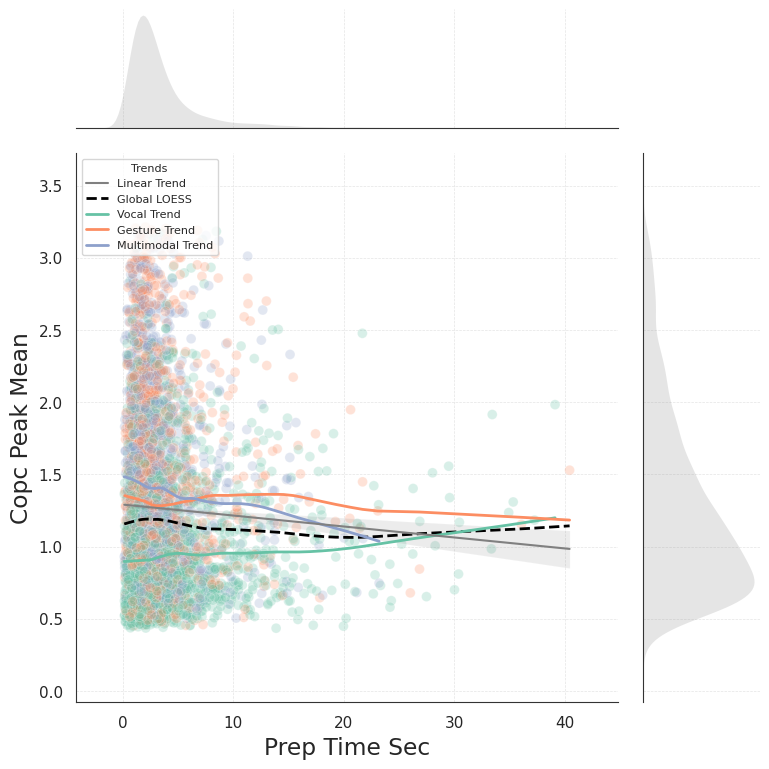
Visual explorations

Overview

Code to prepare the environment
# Import packages
import os
import glob
import pandas as pd
import numpy as np
import matplotlib.pyplot as plt
import seaborn as sns
from tkinter import font
from matplotlib.pyplot import ylabel
import ptitprince as pt
from seaborn import JointGrid
import math
import plotly.express as px


curfolder = os.getcwd()
# Here we store the final data
datafolder = os.path.join(curfolder, "Datasets")
df_z = pd.read_csv(os.path.join(datafolder, "features_df_zscored_feat_final.csv"))
df_n = pd.read_csv(os.path.join(datafolder, "features_df_nonzscored_final.csv"))
Custom functions
modality_palette = {
    "vocal": "#66c2a5",   # greenish
    "gesture": "#fc8d62", # orangish
    "multimodal": "#8da0cb"     # bluish
}

def Tukey_outlier_bounds(data_series):
    """Calculate Tukey's outlier bounds for a given data series.

    Args:
        data_series (pd.Series): Input data series to calculate bounds for

    Returns:
        tuple: (lower_bound, upper_bound) for outlier detection
    """
    Q1 = data_series.quantile(0.25)
    Q3 = data_series.quantile(0.75)
    IQR = Q3 - Q1
    lower_bound = Q1 - 1.5 * IQR
    upper_bound = Q3 + 1.5 * IQR
    return lower_bound, upper_bound

def plot_raincloud_comparison(features_df_nonz, features_df_z, var, var_to_display, log_transform=True, modalityout='', correctionout='c0_only'):
    """Plot raincloud comparison of non-zscored and z-scored data.

    Args:
        features_df_nonz (pd.DataFrame): Non-zscored features dataframe
        features_df_z (pd.DataFrame): Z-scored features dataframe
        var (str): Variable name to plot
        var_to_display (str): Display name for the variable
        log_transform (bool): Whether to apply log transformation
        modalityout (str): Modality to exclude from plotting
        correctionout (str): Correction level to exclude from plotting

    Returns:
        None: Displays the raincloud plot comparison
    """
    import warnings
    warnings.filterwarnings("ignore", category=FutureWarning)

    modality_palette = {
    "vocal": "#66c2a5",   # greenish
    "gesture": "#fc8d62", # orangish
    "multimodal": "#8da0cb"     # bluish
    }

    correction_order = ['c0', 'c1', 'c2']

    # If correctionout is not None, remove that correction_info
    if correctionout is not None:
        features_df_nonz = features_df_nonz[features_df_nonz['correction_info'] != correctionout]
        features_df_z = features_df_z[features_df_z['correction_info'] != correctionout]

    # If modalityout is not None, remove that modality
    if modalityout != '':
        features_df_nonz = features_df_nonz[features_df_nonz['modality'] != modalityout]
        features_df_z = features_df_z[features_df_z['modality'] != modalityout]

    # Remove outliers using Tukey method
    lower_bound, upper_bound = Tukey_outlier_bounds(features_df_nonz[var])

    cleaned_data_nonz = features_df_nonz[
        (features_df_nonz[var] >= lower_bound) &
        (features_df_nonz[var] <= upper_bound)
    ].copy()

    # how much was removed?
    removed_percentage = 100 * (1 - len(cleaned_data_nonz) / len(features_df_nonz))
    print(f"Removed {removed_percentage:.2f}% of data as outliers based on {var_to_display}.")

    # Log-transform
    if log_transform:
        cleaned_data_nonz[var] = np.log(cleaned_data_nonz[var] + 1)

    # Ensure correct order of correction_info
    cleaned_data_nonz['correction_info'] = pd.Categorical(
        cleaned_data_nonz['correction_info'],
        categories=correction_order,
        ordered=True
    )

    # Calculate means of modalities in c0
    mean_c0_mult_nonz = cleaned_data_nonz[(cleaned_data_nonz['correction_info'] == 'c0') & (cleaned_data_nonz['modality'] == 'multimodal')][var].mean()
    mean_c0_ges_nonz = cleaned_data_nonz[(cleaned_data_nonz['correction_info'] == 'c0') & (cleaned_data_nonz['modality'] == 'gesture')][var].mean()
    mean_c0_voc_nonz = cleaned_data_nonz[(cleaned_data_nonz['correction_info'] == 'c0') & (cleaned_data_nonz['modality'] == 'vocal')][var].mean()

    #### Z-scored data ####

    # identify outliers as 5*sd away from the mean
    mean_val = features_df_z[var].mean()
    std_val = features_df_z[var].std()
    outlier_threshold_upper = mean_val + 2 * std_val
    outlier_threshold_lower = mean_val - 2 * std_val
    cleaned_data_z = features_df_z[(features_df_z[var] <= outlier_threshold_upper) & (features_df_z[var] >= outlier_threshold_lower)].copy()
    print("Percentage of z-scored data removed: ", (features_df_z.shape[0] - cleaned_data_z.shape[0]) / features_df_z.shape[0] * 100)

    # Ensure correct order of correction_info
    cleaned_data_z['correction_info'] = pd.Categorical(
        cleaned_data_z['correction_info'],
        categories=correction_order,
        ordered=True
    )

    # calculate mean of gesture, c0
    mean_c0_mult_z = cleaned_data_z[(cleaned_data_z['correction_info'] == 'c0') & (cleaned_data_z['modality'] == 'multimodal')][var].mean()
    mean_c0_ges_z = cleaned_data_z[(cleaned_data_z['correction_info'] == 'c0') & (cleaned_data_z['modality'] == 'gesture')][var].mean()#
    mean_c0_voc_z = cleaned_data_z[(cleaned_data_z['correction_info'] == 'c0') & (cleaned_data_z['modality'] == 'vocal')][var].mean()#

    # Create the figure and axes
    fig, axes = plt.subplots(
        nrows=1,
        ncols=2,
        figsize=(18, 7),
        sharey=False
    )

    # ---------- LEFT: non-zscored + log ----------
    pt.RainCloud(
        x='correction_info',
        y=var,
        hue='modality',
        data=cleaned_data_nonz,      
        palette=modality_palette,
        width_viol=0.6,
        width_box=0.15,
        move=0.15,
        bw=0.4,
        alpha=0.5,
        dodge=True,
        pointplot=True,
        orient='v',
        ax=axes[0]
    )
    if modalityout == 'vocal':
        axes[0].axhline(mean_c0_mult_nonz, color=modality_palette['multimodal'],
                        linestyle='--', linewidth=1.5)
        axes[0].axhline(mean_c0_ges_nonz, color=modality_palette['gesture'],
                        linestyle='--', linewidth=1.5)
    elif modalityout == 'gesture':
        axes[0].axhline(mean_c0_mult_nonz, color=modality_palette['multimodal'],
                        linestyle='--', linewidth=1.5)
        axes[0].axhline(mean_c0_voc_nonz, color=modality_palette['vocal'],
                        linestyle='--', linewidth=1.5)
    else:
        axes[0].axhline(mean_c0_mult_nonz, color=modality_palette['multimodal'],
                        linestyle='--', linewidth=1.5)
        axes[0].axhline(mean_c0_ges_nonz, color=modality_palette['gesture'],
                        linestyle='--', linewidth=1.5)
        axes[0].axhline(mean_c0_voc_nonz, color=modality_palette['vocal'], 
                        linestyle='--', linewidth=1.5)
        
    axes[0].set_title("Non-zscored", fontsize=16, weight='bold')
    if log_transform:
        ylabel = f"{var_to_display} (log)"
    else:
        ylabel = var_to_display
    axes[0].set_ylabel(ylabel)
    axes[0].set_xlabel("")


    # ---------- RIGHT: z-scored ----------
    pt.RainCloud(
        x='correction_info',
        y=var,
        hue='modality',
        data=cleaned_data_z,        
        palette=modality_palette,
        width_viol=0.6,
        width_box=0.15,
        move=0.15,
        bw=0.4,
        alpha=0.5,
        dodge=True,
        pointplot=True,
        orient='v',
        ax=axes[1]
    )

    if modalityout == 'vocal':
        axes[1].axhline(mean_c0_mult_z, color=modality_palette['multimodal'],
                        linestyle='--', linewidth=1.5)
        axes[1].axhline(mean_c0_ges_z, color=modality_palette['gesture'],
                        linestyle='--', linewidth=1.5)
    elif modalityout == 'gesture':
        axes[1].axhline(mean_c0_mult_z, color=modality_palette['multimodal'],
                        linestyle='--', linewidth=1.5)
        axes[1].axhline(mean_c0_voc_z, color=modality_palette['vocal'],
                        linestyle='--', linewidth=1.5)
    else:
        axes[1].axhline(mean_c0_mult_z, color=modality_palette['multimodal'],
                        linestyle='--', linewidth=1.5)
        axes[1].axhline(mean_c0_ges_z, color=modality_palette['gesture'],
                        linestyle='--', linewidth=1.5)
        axes[1].axhline(mean_c0_voc_z, color=modality_palette['vocal'], 
                        linestyle='--', linewidth=1.5)
        
    axes[1].axhline(0, color='black', linestyle='-', linewidth=1, alpha=0.6)

    axes[1].set_title("Z-scored", fontsize=16, weight='bold')
    axes[1].set_ylabel(var_to_display)
    axes[1].set_xlabel("")

    # Extract legend info from ONE axis only 
    handles, labels = axes[0].get_legend_handles_labels()

    # Keep only the first two (gesture / multimodal)
    handles = handles[:2]
    labels = labels[:2]

    # Remove ALL axis-level legends 
    for ax in axes:
        if ax.get_legend() is not None:
            ax.get_legend().remove()

    # Add ONE shared legend to the figure 
    fig.legend(
        handles,
        labels,
        title="modality",
        loc="center right",
        frameon=True
    )

    # Final cosmetics
    for ax in axes:
        ax.tick_params(axis='x', labelsize=12)
        ax.tick_params(axis='y', labelsize=12)
        ax.grid(True, axis='y', linestyle='--', alpha=0.6)
        ax.set_facecolor("white")

    plt.tight_layout()
    plt.show()


def plot_relationship(df, x_var, y_var, hue_var=None, remove_outliers=True, modalityout='', sign_var=None):
    """Plot relationship between two variables with optional hue and modality filtering.

    Creates a joint plot with scatter points, marginal distributions, and trend lines.
    Supports filtering by modality and optional outlier removal.

    Args:
        df (pd.DataFrame): Input dataframe containing the data
        x_var (str): Variable name for x-axis
        y_var (str): Variable name for y-axis
        hue_var (str, optional): Variable name for hue (color) grouping
        remove_outliers (bool): Whether to remove outliers using Tukey method
        modalityout (str): Modality to exclude from plotting
        sign_var (str, optional): Variable indicating sign (positive/negative) for trend lines

    Returns:
        None: Displays the joint plot
    """
    
    modality_palette = {
    "vocal": "#66c2a5",   # greenish
    "gesture": "#fc8d62", # orangish
    "multimodal": "#8da0cb"     # bluish
    }
    
    if remove_outliers:
        # Remove outliers based on Tukey method for y_var
        Q1 = df[y_var].quantile(0.25)
        Q3 = df[y_var].quantile(0.75)
        IQR = Q3 - Q1
        lower_bound = Q1 - 1.5 * IQR
        upper_bound = Q3 + 1.5 * IQR
        df = df[(df[y_var] >= lower_bound) & (df[y_var] <= upper_bound)]

    # Set up modern styling
    sns.set_context("notebook", font_scale=1.4)
    sns.set_style("whitegrid")
    plt.rcParams.update({
        "axes.edgecolor": "0.2",
        "axes.linewidth": 0.8,
        "grid.color": "#e5e5e5",
        "grid.linestyle": "--",
        "grid.linewidth": 0.5,
        "font.family": "sans-serif",
        "font.sans-serif": ["DejaVu Sans"],
        "axes.spines.right": False,
        "axes.spines.top": False,
    })


    df = df[df['modality'] != modalityout]

    # Set up JointGrid
    g = JointGrid(
        data=df,
        x=x_var,
        y=y_var,
        height=8,
        space=0,
        ratio=4
    )

    # Scatter plot (main axis)
    sns.scatterplot(
        data=df,
        x=x_var,
        y=y_var,
        hue='modality',
        palette=modality_palette,
        alpha=0.25,
        s=50,
        ax=g.ax_joint,
        legend=False
    )

    # Global LOESS trend (black dashed)
    sns.regplot(
        data=df,
        x=x_var,
        y=y_var,
        scatter=False,
        lowess=True,
        line_kws={'color': 'black', 'linewidth': 2, 'linestyle': '--'},
        ax=g.ax_joint
    )

    # if sign_var is provided, plot separate lines for modality-sign_var level combination, otherwise just modality
    if sign_var is not None:
        for modality in df['modality'].unique():
            for sign in df[sign_var].unique():
                subset = df[(df['modality'] == modality) & (df[sign_var] == sign)]
                sns.regplot(
                    data=subset,
                    x=x_var,
                    y=y_var,
                    scatter=False,
                    lowess=True,
                    line_kws={'color': modality_palette[modality], 'linewidth': 2, 'linestyle': '--' if sign == -1 else '-'},
                    ax=g.ax_joint
                )
    else:
        for modality in df['modality'].unique():
            subset = df[df['modality'] == modality]
            sns.regplot(
                data=subset,
                x=x_var,
                y=y_var,
                scatter=False,
                lowess=True,
                line_kws={'color': modality_palette[modality], 'linewidth': 2},
                ax=g.ax_joint
            )

    # Marginal KDEs
    sns.kdeplot(
        data=df,
        x=x_var,
        ax=g.ax_marg_x,
        fill=True,
        color='gray',
        alpha=0.2,
        linewidth=0
    )
    sns.kdeplot(
        data=df,
        y=y_var,
        ax=g.ax_marg_y,
        fill=True,
        color='gray',
        alpha=0.2,
        linewidth=0
    )

    # add also linear regression line
    sns.regplot(
        data=df,
        x=x_var,
        y=y_var,
        scatter=False,
        line_kws={'color': 'grey', 'linewidth': 1.5},
        ax=g.ax_joint
    )


    if sign_var is not None:
        # add legend for all used lines
        handles = [
                plt.Line2D([0], [0], color='grey', linestyle='-', linewidth=1.5, label='Linear Trend'),
                plt.Line2D([0], [0], color='black', linestyle='--', linewidth=2, label='Global LOESS'),
                plt.Line2D([0], [0], color=modality_palette['vocal'], linestyle='-', linewidth=2, label='Vocal Trend'),
                plt.Line2D([0], [0], color=modality_palette['vocal'], linestyle='--', linewidth=2, label='Vocal Trend (Negative)'),
                plt.Line2D([0], [0], color=modality_palette['gesture'], linestyle='-', linewidth=2, label='Gesture Trend'),
                plt.Line2D([0], [0], color=modality_palette['gesture'], linestyle='--', linewidth=2, label='Gesture Trend (Negative)'),
                plt.Line2D([0], [0], color=modality_palette['multimodal'], linestyle='-', linewidth=2, label='Multimodal Trend'),
                plt.Line2D([0], [0], color=modality_palette['multimodal'], linestyle='--', linewidth=2, label='Multimodal Trend (Negative)'),
            ]
    else:
        handles = [
                plt.Line2D([0], [0], color='grey', linestyle='-', linewidth=1.5, label='Linear Trend'),
                plt.Line2D([0], [0], color='black', linestyle='--', linewidth=2, label='Global LOESS'),
                plt.Line2D([0], [0], color=modality_palette['vocal'], linestyle='-', linewidth=2, label='Vocal Trend'),
                plt.Line2D([0], [0], color=modality_palette['gesture'], linestyle='-', linewidth=2, label='Gesture Trend'),
                plt.Line2D([0], [0], color=modality_palette['multimodal'], linestyle='-', linewidth=2, label='Multimodal Trend'),
            ]
    

    g.ax_joint.legend(
        handles=handles,
        loc='upper left',
        frameon=True,
        title='Trends',
        fontsize=8,
        title_fontsize=8
    )

    # add lable for y axes 'Change in envelope (integral)'ArithmeticError
    g.ax_joint.set_xlabel(x_var.replace("_", " ").title())
    g.ax_joint.set_ylabel(y_var.replace("_", " ").title())


    # Minimal tick label visibility tweaks
    g.ax_joint.tick_params(axis='x', labelsize=11)
    g.ax_joint.tick_params(axis='y', labelsize=11)

    # Tight layout
    plt.tight_layout()
    plt.show()

def plot_raincloud_comparison_with_grids(features_df_nonz, var, var_to_display, grid_var='effort_category', log_transform=True, modalityout='', correctionout='c0_only'):
    """Plot raincloud comparison with grid levels for non-zscored data.

    Creates a grid of raincloud plots comparing different correction levels across
    different levels of a specified grid variable (e.g., effort category).

    Args:
        features_df_nonz (pd.DataFrame): Non-zscored features dataframe
        var (str): Variable name to plot
        var_to_display (str): Display name for the variable
        grid_var (str): Variable to use for creating grid levels (default: 'effort_category')
        log_transform (bool): Whether to apply log transformation
        modalityout (str): Modality to exclude from plotting
        correctionout (str): Correction level to exclude from plotting

    Returns:
        None: Displays the grid of raincloud plots
    """
    import warnings
    warnings.filterwarnings("ignore", category=FutureWarning)

    modality_palette = {
        "vocal":      "#66c2a5",
        "gesture":    "#fc8d62",
        "multimodal": "#8da0cb"
    }

    correction_order = ['c0', 'c1', 'c2']

    # Filter out unwanted correction_info and modality
    if correctionout is not None:
        features_df_nonz = features_df_nonz[features_df_nonz['correction_info'] != correctionout]
    if modalityout != '':
        features_df_nonz = features_df_nonz[features_df_nonz['modality'] != modalityout]

    # Remove outliers using Tukey method
    lower_bound, upper_bound = Tukey_outlier_bounds(features_df_nonz[var])
    cleaned_data = features_df_nonz[
        (features_df_nonz[var] >= lower_bound) &
        (features_df_nonz[var] <= upper_bound)
    ].copy()

    removed_percentage = 100 * (1 - len(cleaned_data) / len(features_df_nonz))
    print(f"Removed {removed_percentage:.2f}% of data as outliers based on {var_to_display}.")

    # Log-transform
    if log_transform:
        cleaned_data[var] = np.log(cleaned_data[var] + 1)

    # Ensure correct order of correction_info
    cleaned_data['correction_info'] = pd.Categorical(
        cleaned_data['correction_info'],
        categories=correction_order,
        ordered=True
    )

    # Get grid levels from the specified variable
    grid_levels = sorted(cleaned_data[grid_var].unique())
    n_levels = len(grid_levels)

    fig, axes = plt.subplots(
        nrows=1,
        ncols=n_levels,
        figsize=(7 * n_levels, 7),
        sharey=True
    )
    if n_levels == 1:
        axes = [axes]

    for ax, level in zip(axes, grid_levels):
        subset = cleaned_data[cleaned_data[grid_var] == level]

        # Compute c0 means per modality for reference lines
        active_modalities = [m for m in ['multimodal', 'gesture', 'vocal'] if m != modalityout]
        c0_means = {
            m: subset[(subset['correction_info'] == 'c0') & (subset['modality'] == m)][var].mean()
            for m in active_modalities
        }

        pt.RainCloud(
            x='correction_info',
            y=var,
            hue='modality',
            data=subset,
            palette=modality_palette,
            width_viol=0.6,
            width_box=0.15,
            move=0.15,
            bw=0.4,
            alpha=0.5,
            dodge=True,
            pointplot=True,
            orient='v',
            ax=ax
        )

        # Draw c0 reference lines
        for modality, mean_val in c0_means.items():
            ax.axhline(mean_val, color=modality_palette[modality],
                       linestyle='--', linewidth=1.5)

        ax.set_title(f"{grid_var}: {level}", fontsize=16, weight='bold')
        ax.set_xlabel("")
        ax.tick_params(axis='x', labelsize=12)
        ax.tick_params(axis='y', labelsize=12)
        ax.grid(True, axis='y', linestyle='--', alpha=0.6)
        ax.set_facecolor("white")

        if ax is axes[0]:
            ylabel = f"{var_to_display} (log)" if log_transform else var_to_display
            ax.set_ylabel(ylabel, fontsize=13)
        else:
            ax.set_ylabel("")

        # Remove per-axis legend
        if ax.get_legend() is not None:
            ax.get_legend().remove()

    # Shared legend from first axis
    handles, labels = axes[0].get_legend_handles_labels()
    n_modalities = len(active_modalities)
    fig.legend(
        handles[:n_modalities],
        labels[:n_modalities],
        title="modality",
        loc="center right",
        frameon=True
    )

    plt.suptitle(var_to_display, fontsize=18, weight='bold', y=1.02)
    plt.tight_layout()
    plt.show()
Correlation

Before correlating all features, we transform number of peaks into peak_rate to avoid time-dependent variables being correlated

for index, row in df_n.iterrows():
    for col in df_n.columns:
        if 'peak_n' in col and not col.endswith('_rate'):
            duration = row['duration_trial']
            if duration > 0:  # to avoid division by zero
                df_n.at[index, col + '_rate'] = row[col] / duration
            else:
                df_n.at[index, col + '_rate'] = np.nan  # or some other value to indicate invalid rate

# create subdf that has only columns that contain strings: 'envelope_norm', 'arm_moment_sum_change' and 'COPc'
subdf_n = df_n.filter(regex='envelope_norm|arm_moment_sum_change|COPc|modality|correction_info')
subdf_n.head()
arm_moment_sum_change_Gmean arm_moment_sum_change_Gstd arm_moment_sum_change_peak_mean arm_moment_sum_change_peak_std arm_moment_sum_change_peak_n arm_moment_sum_change_peak_times arm_moment_sum_change_peak_signs arm_moment_sum_change_integral arm_moment_sum_change_integral_norm arm_moment_sum_change_range ... envelope_norm_integral envelope_norm_integral_norm envelope_norm_range envelope_norm_max envelope_norm_min modality correction_info arm_moment_sum_change_peak_n_rate COPc_peak_n_rate envelope_norm_peak_n_rate
0 6.61338 4.83128 20.08211 0.00000 1 [4598.0] [1.0] 34093.02223 6.60974 25.33497 ... 354.71586 0.06877 0.27451 0.30444 0.02994 vocal c1 0.000194 0.001939 0.000388
1 5.43659 3.64453 12.69215 2.40044 2 [572.0, 3214.0] [1.0, 1.0] 32330.70457 5.43373 19.71060 ... 633.11275 0.10641 0.81814 0.83954 0.02140 vocal c2 0.000336 0.001681 0.001009
2 8.42286 6.82173 14.01212 2.84387 3 [1180.0, 2690.0, 5490.0] [1.0, 1.0, 1.0] 52290.18193 8.42032 23.31745 ... 272.90953 0.04395 0.14260 0.17108 0.02848 vocal c1 0.000483 0.001128 0.001128
3 4.59322 5.27262 19.45120 1.13883 3 [876.0, 9018.0, 9448.0] [1.0, 1.0, 1.0] 46241.12750 4.59288 23.45933 ... 490.76049 0.04874 0.12756 0.15886 0.03130 vocal c0_only 0.000298 0.001788 0.000894
4 2.95832 2.37248 9.87082 NaN 0 [] [] 43817.86603 2.95707 12.16759 ... 315.61850 0.02130 0.00103 0.02226 0.02123 gesture c0 0.000000 0.000607 0.000000

5 rows Ă— 41 columns

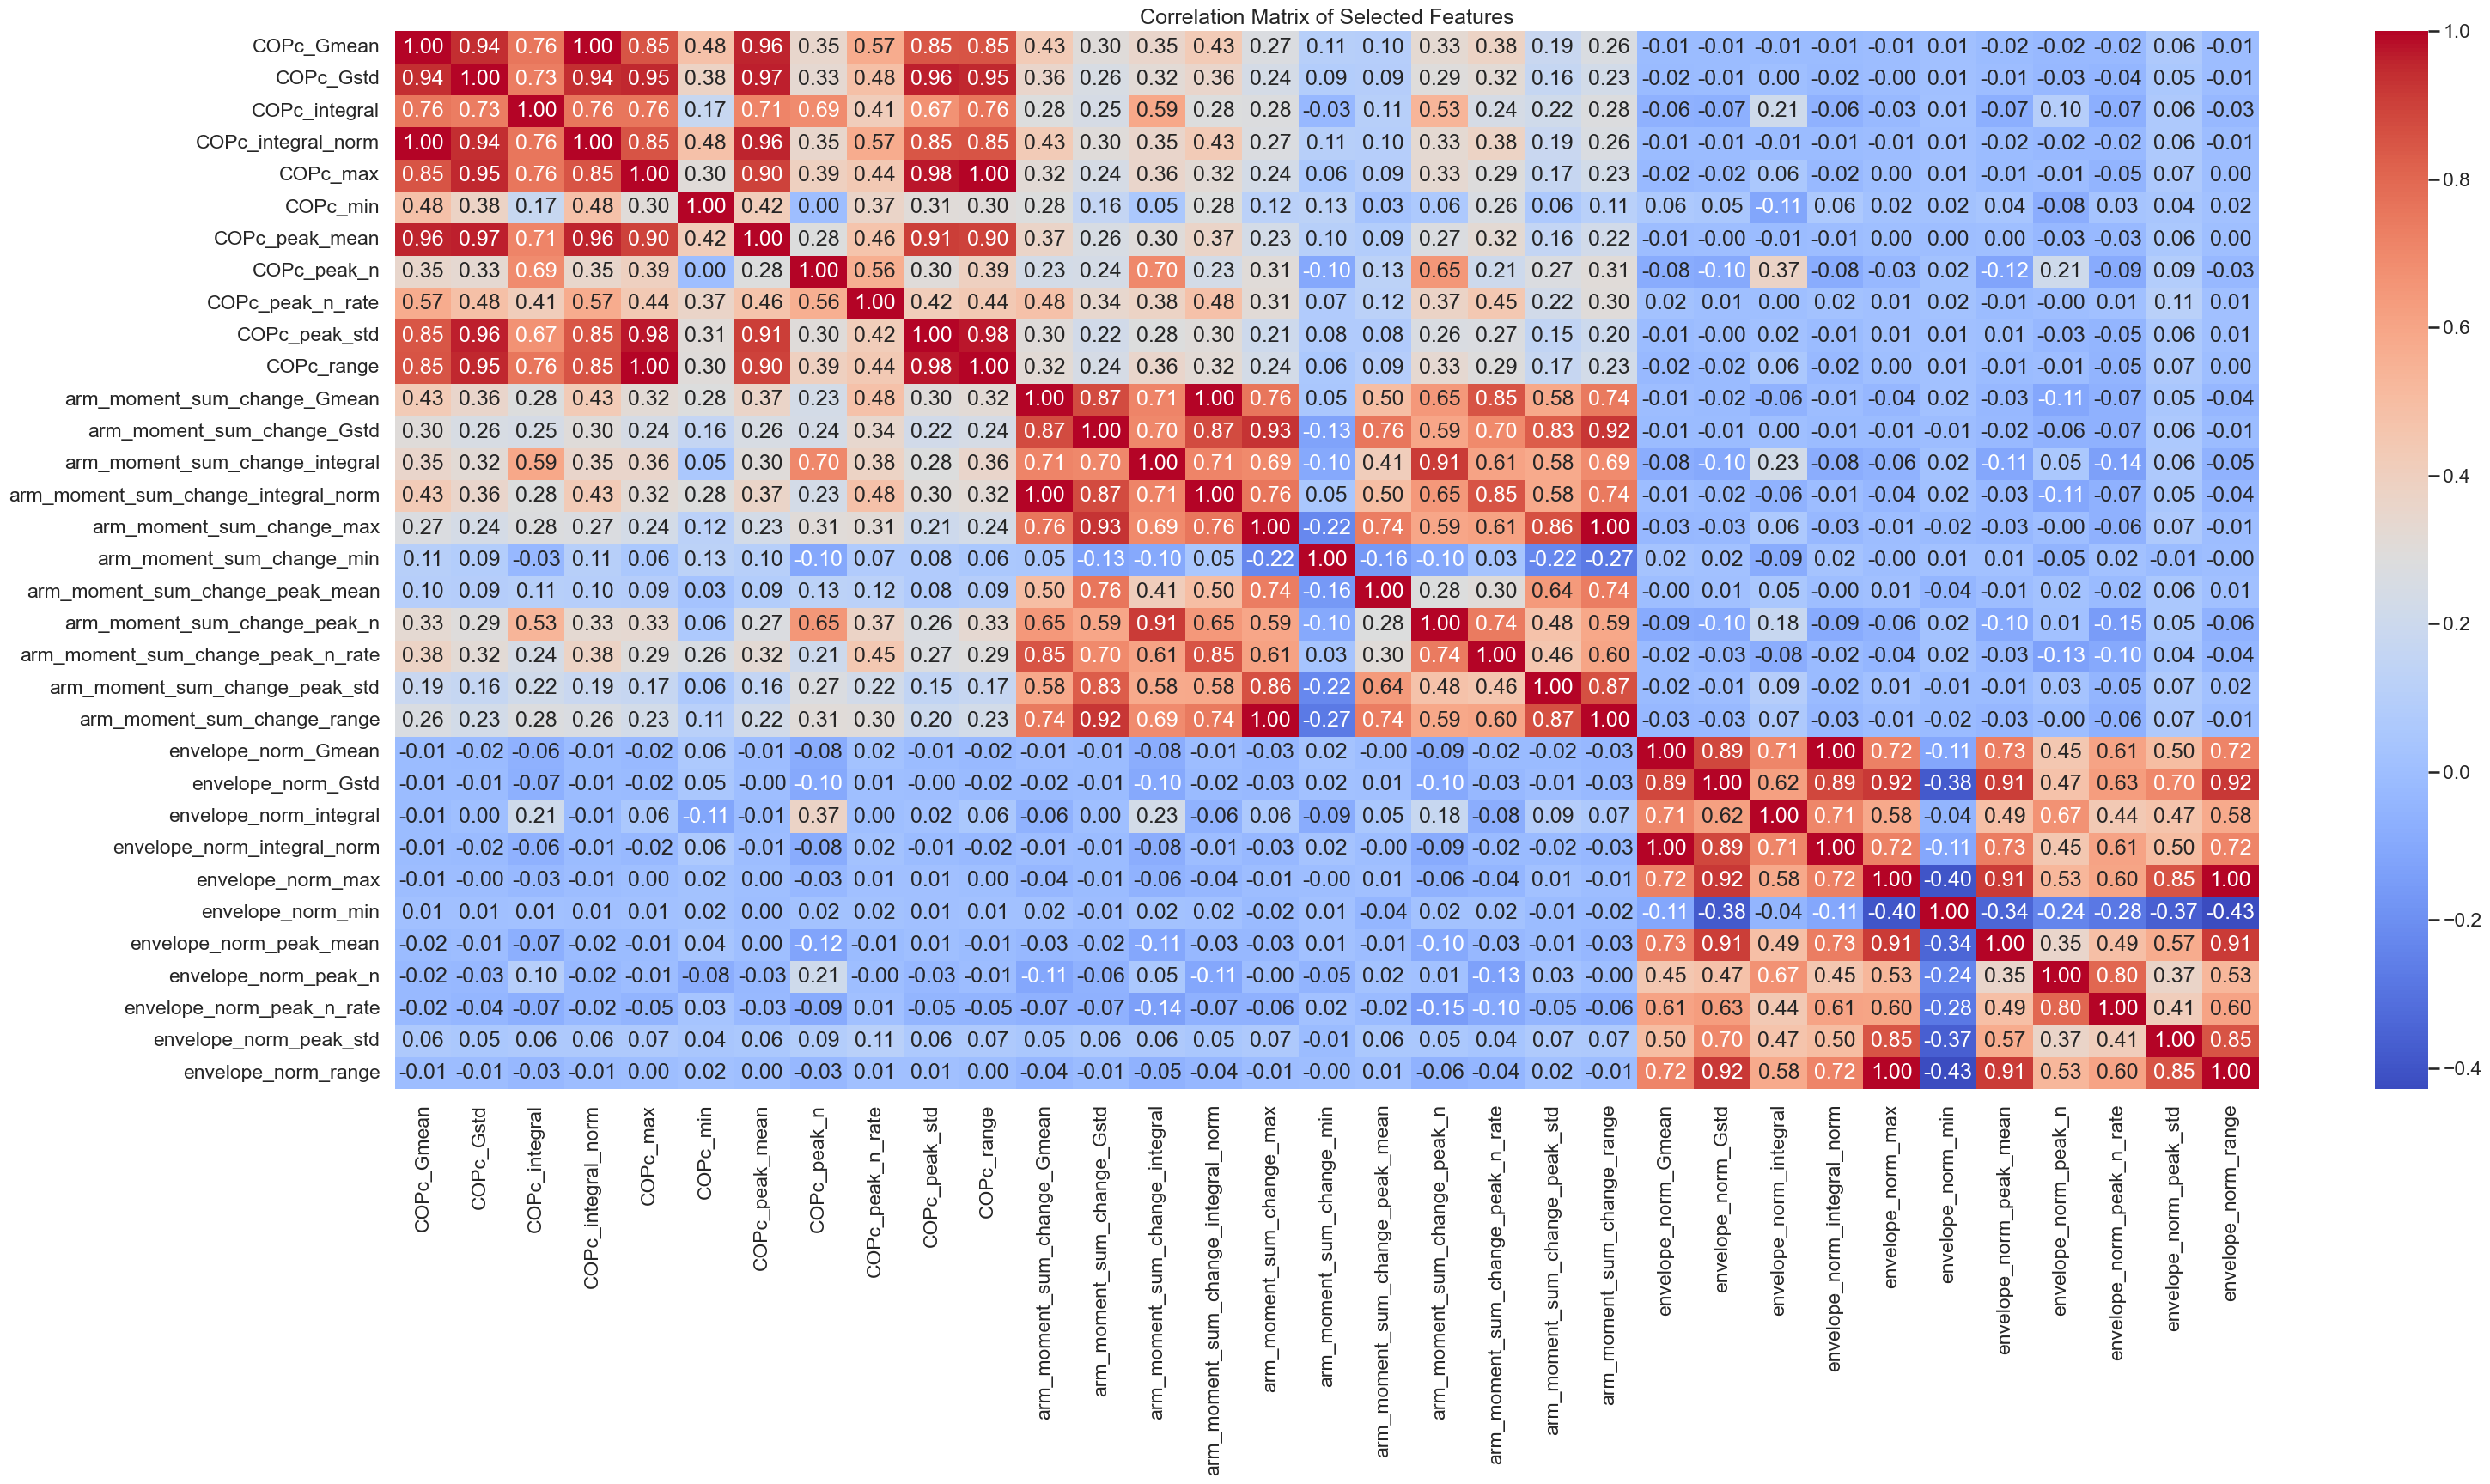
Correlation general

subdf_n_numeric = subdf_n.select_dtypes(include=[np.number])
subdf_n_numeric = subdf_n_numeric.reindex(sorted(subdf_n_numeric.columns), axis=1)

# correlation matrix
corr_matrix = subdf_n_numeric.corr()
plt.figure(figsize=(35,16))
sns.heatmap(corr_matrix, annot=True, fmt=".2f", cmap='coolwarm')
plt.title("Correlation Matrix of Selected Features")
plt.show()

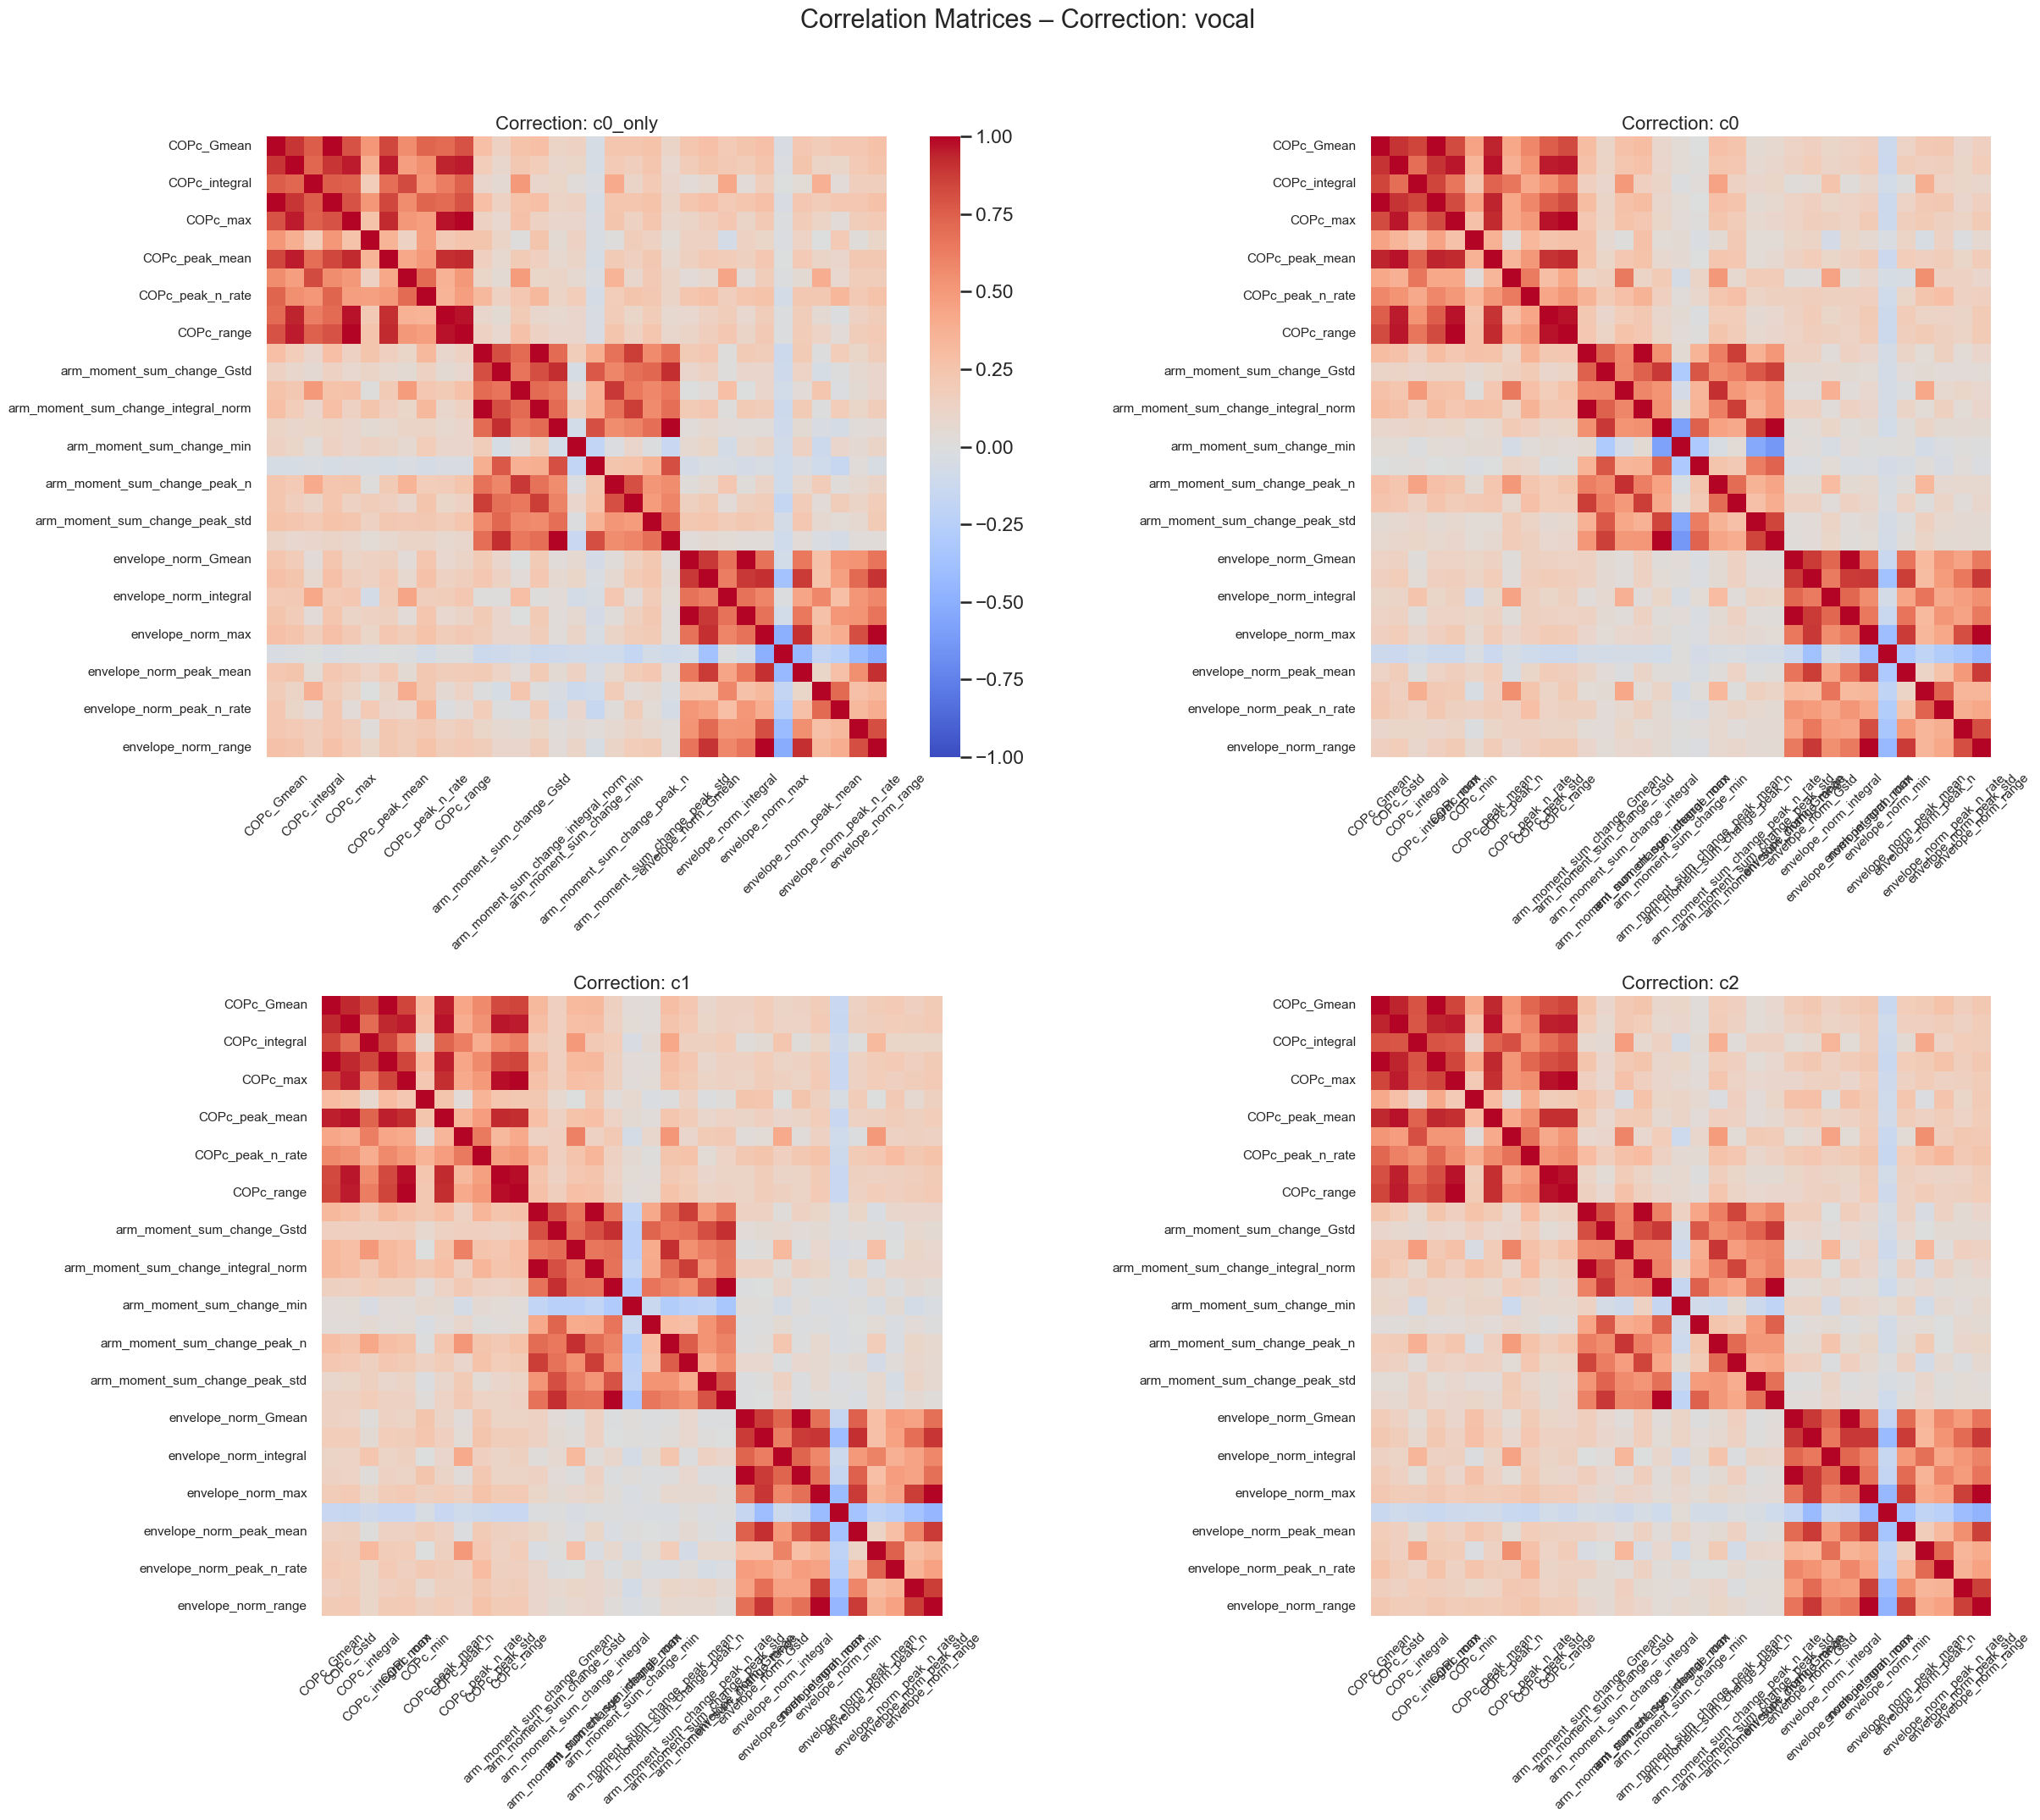
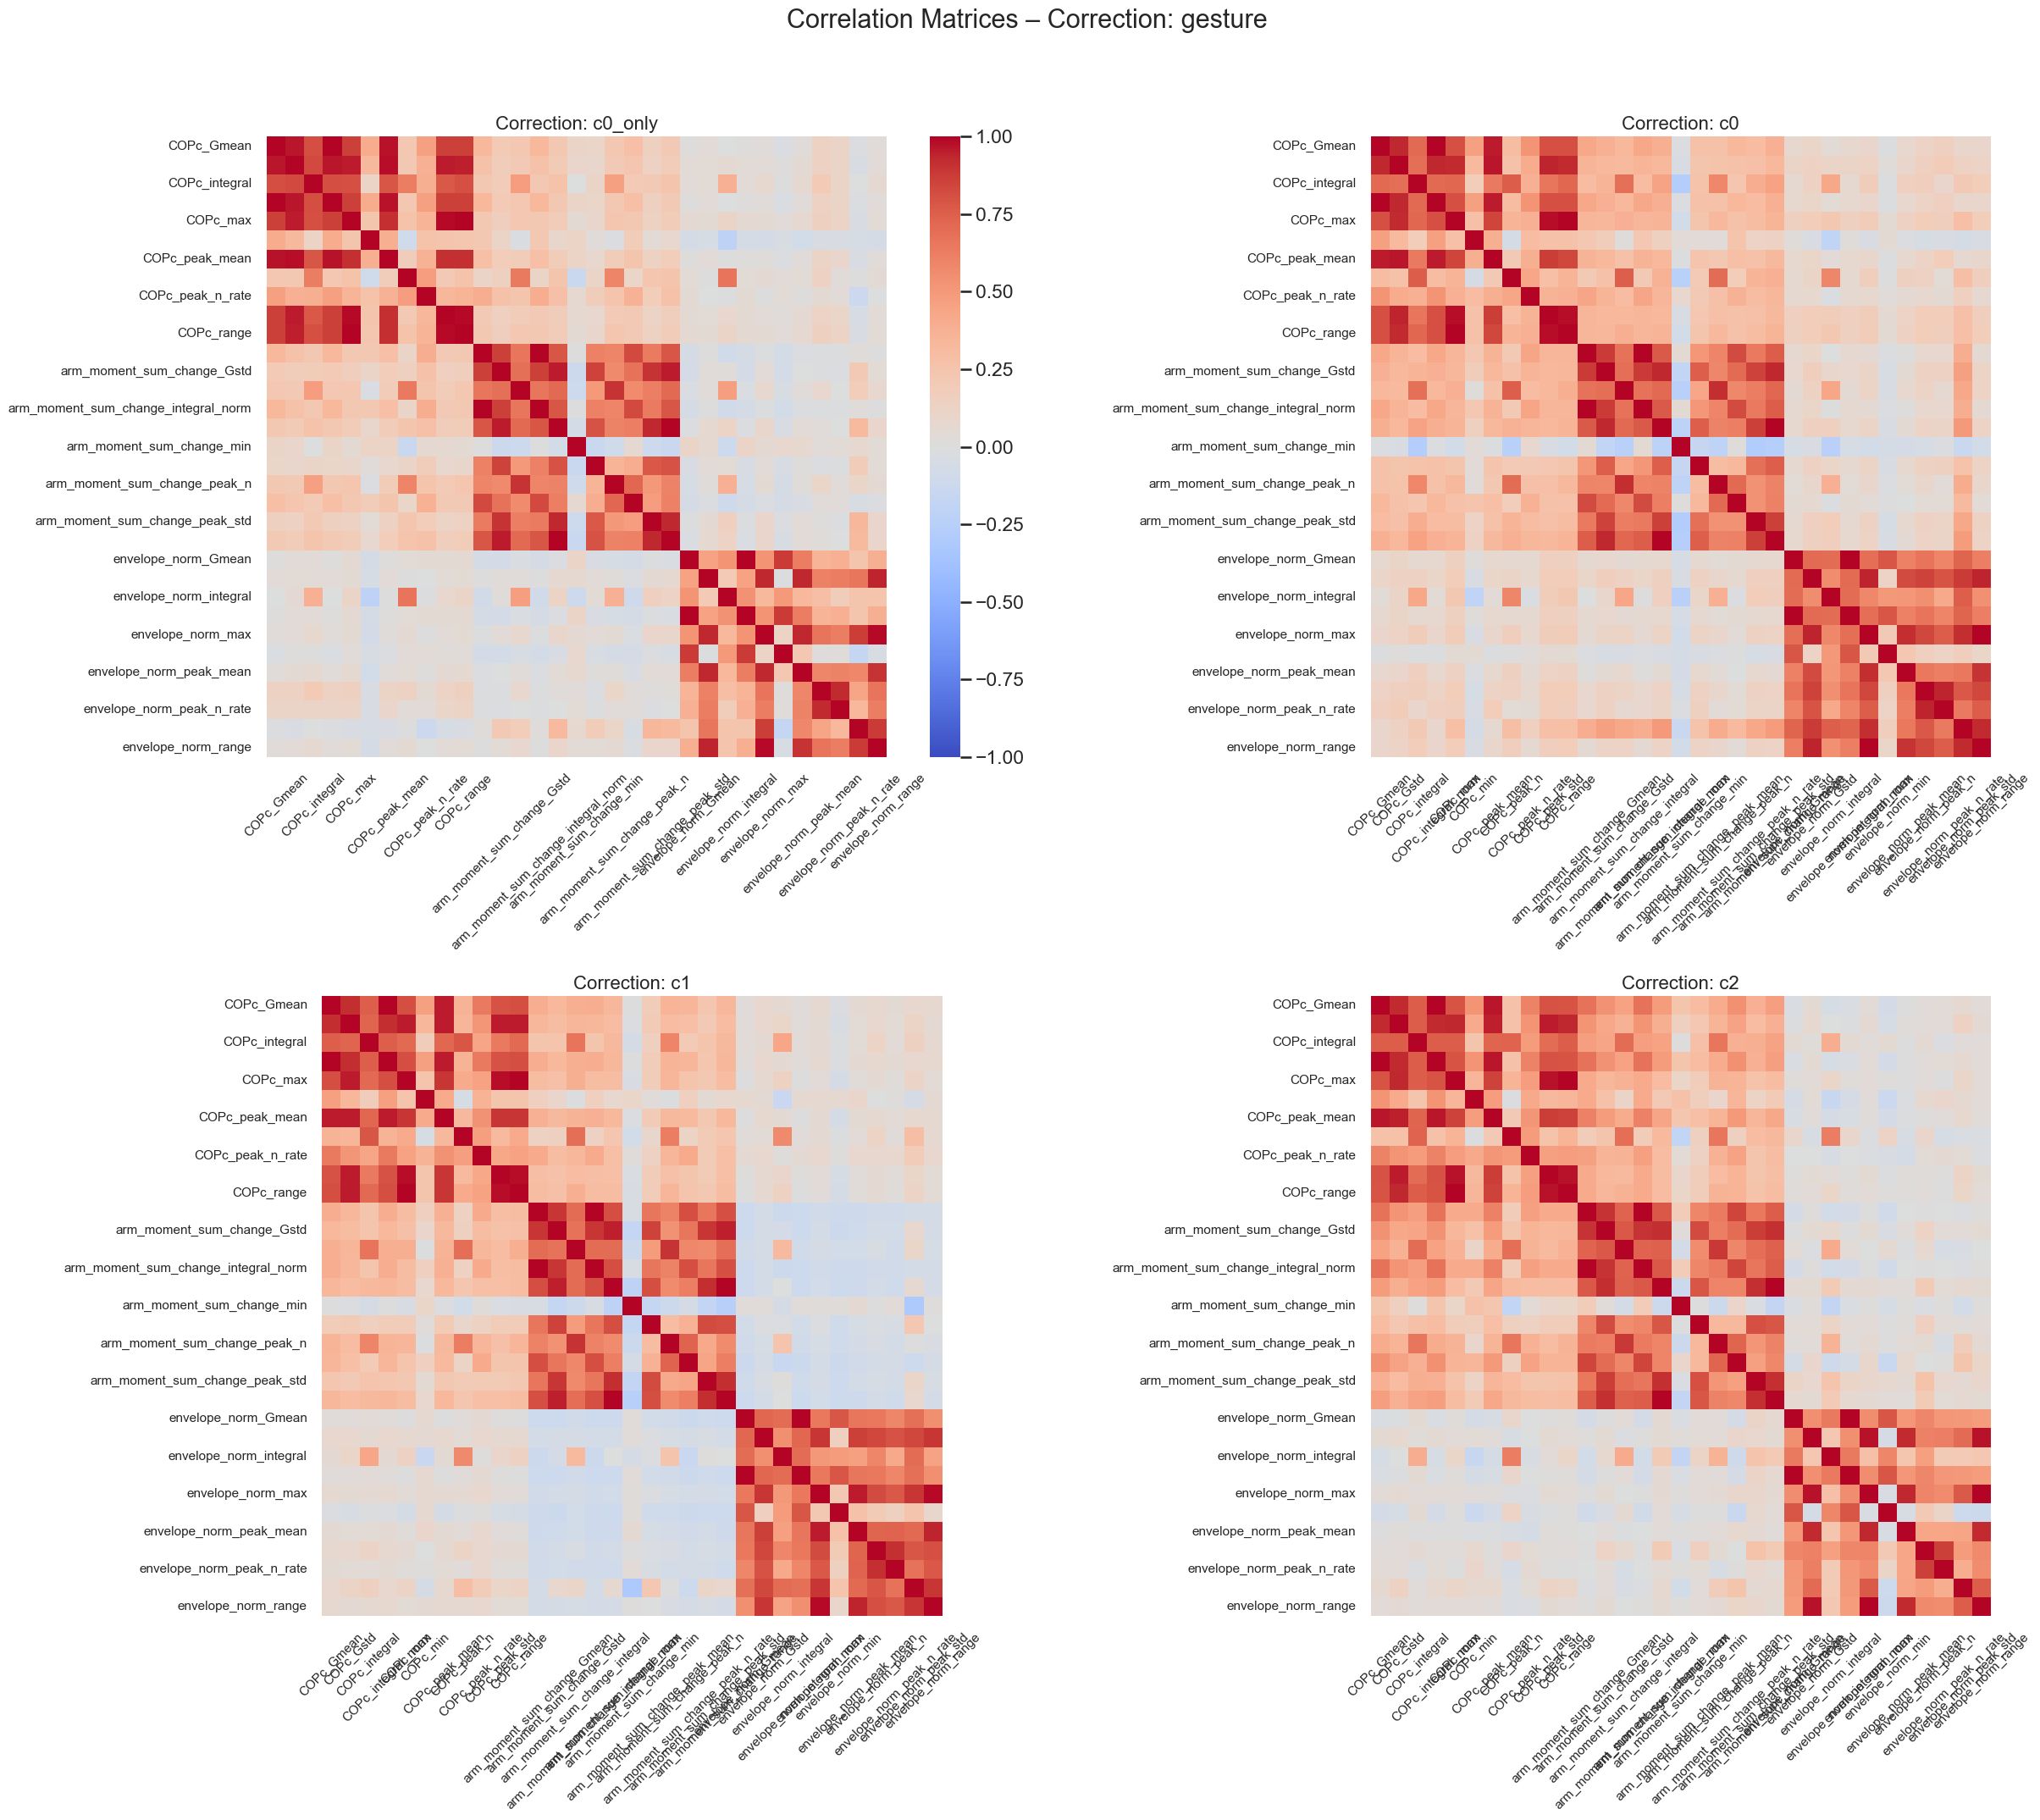
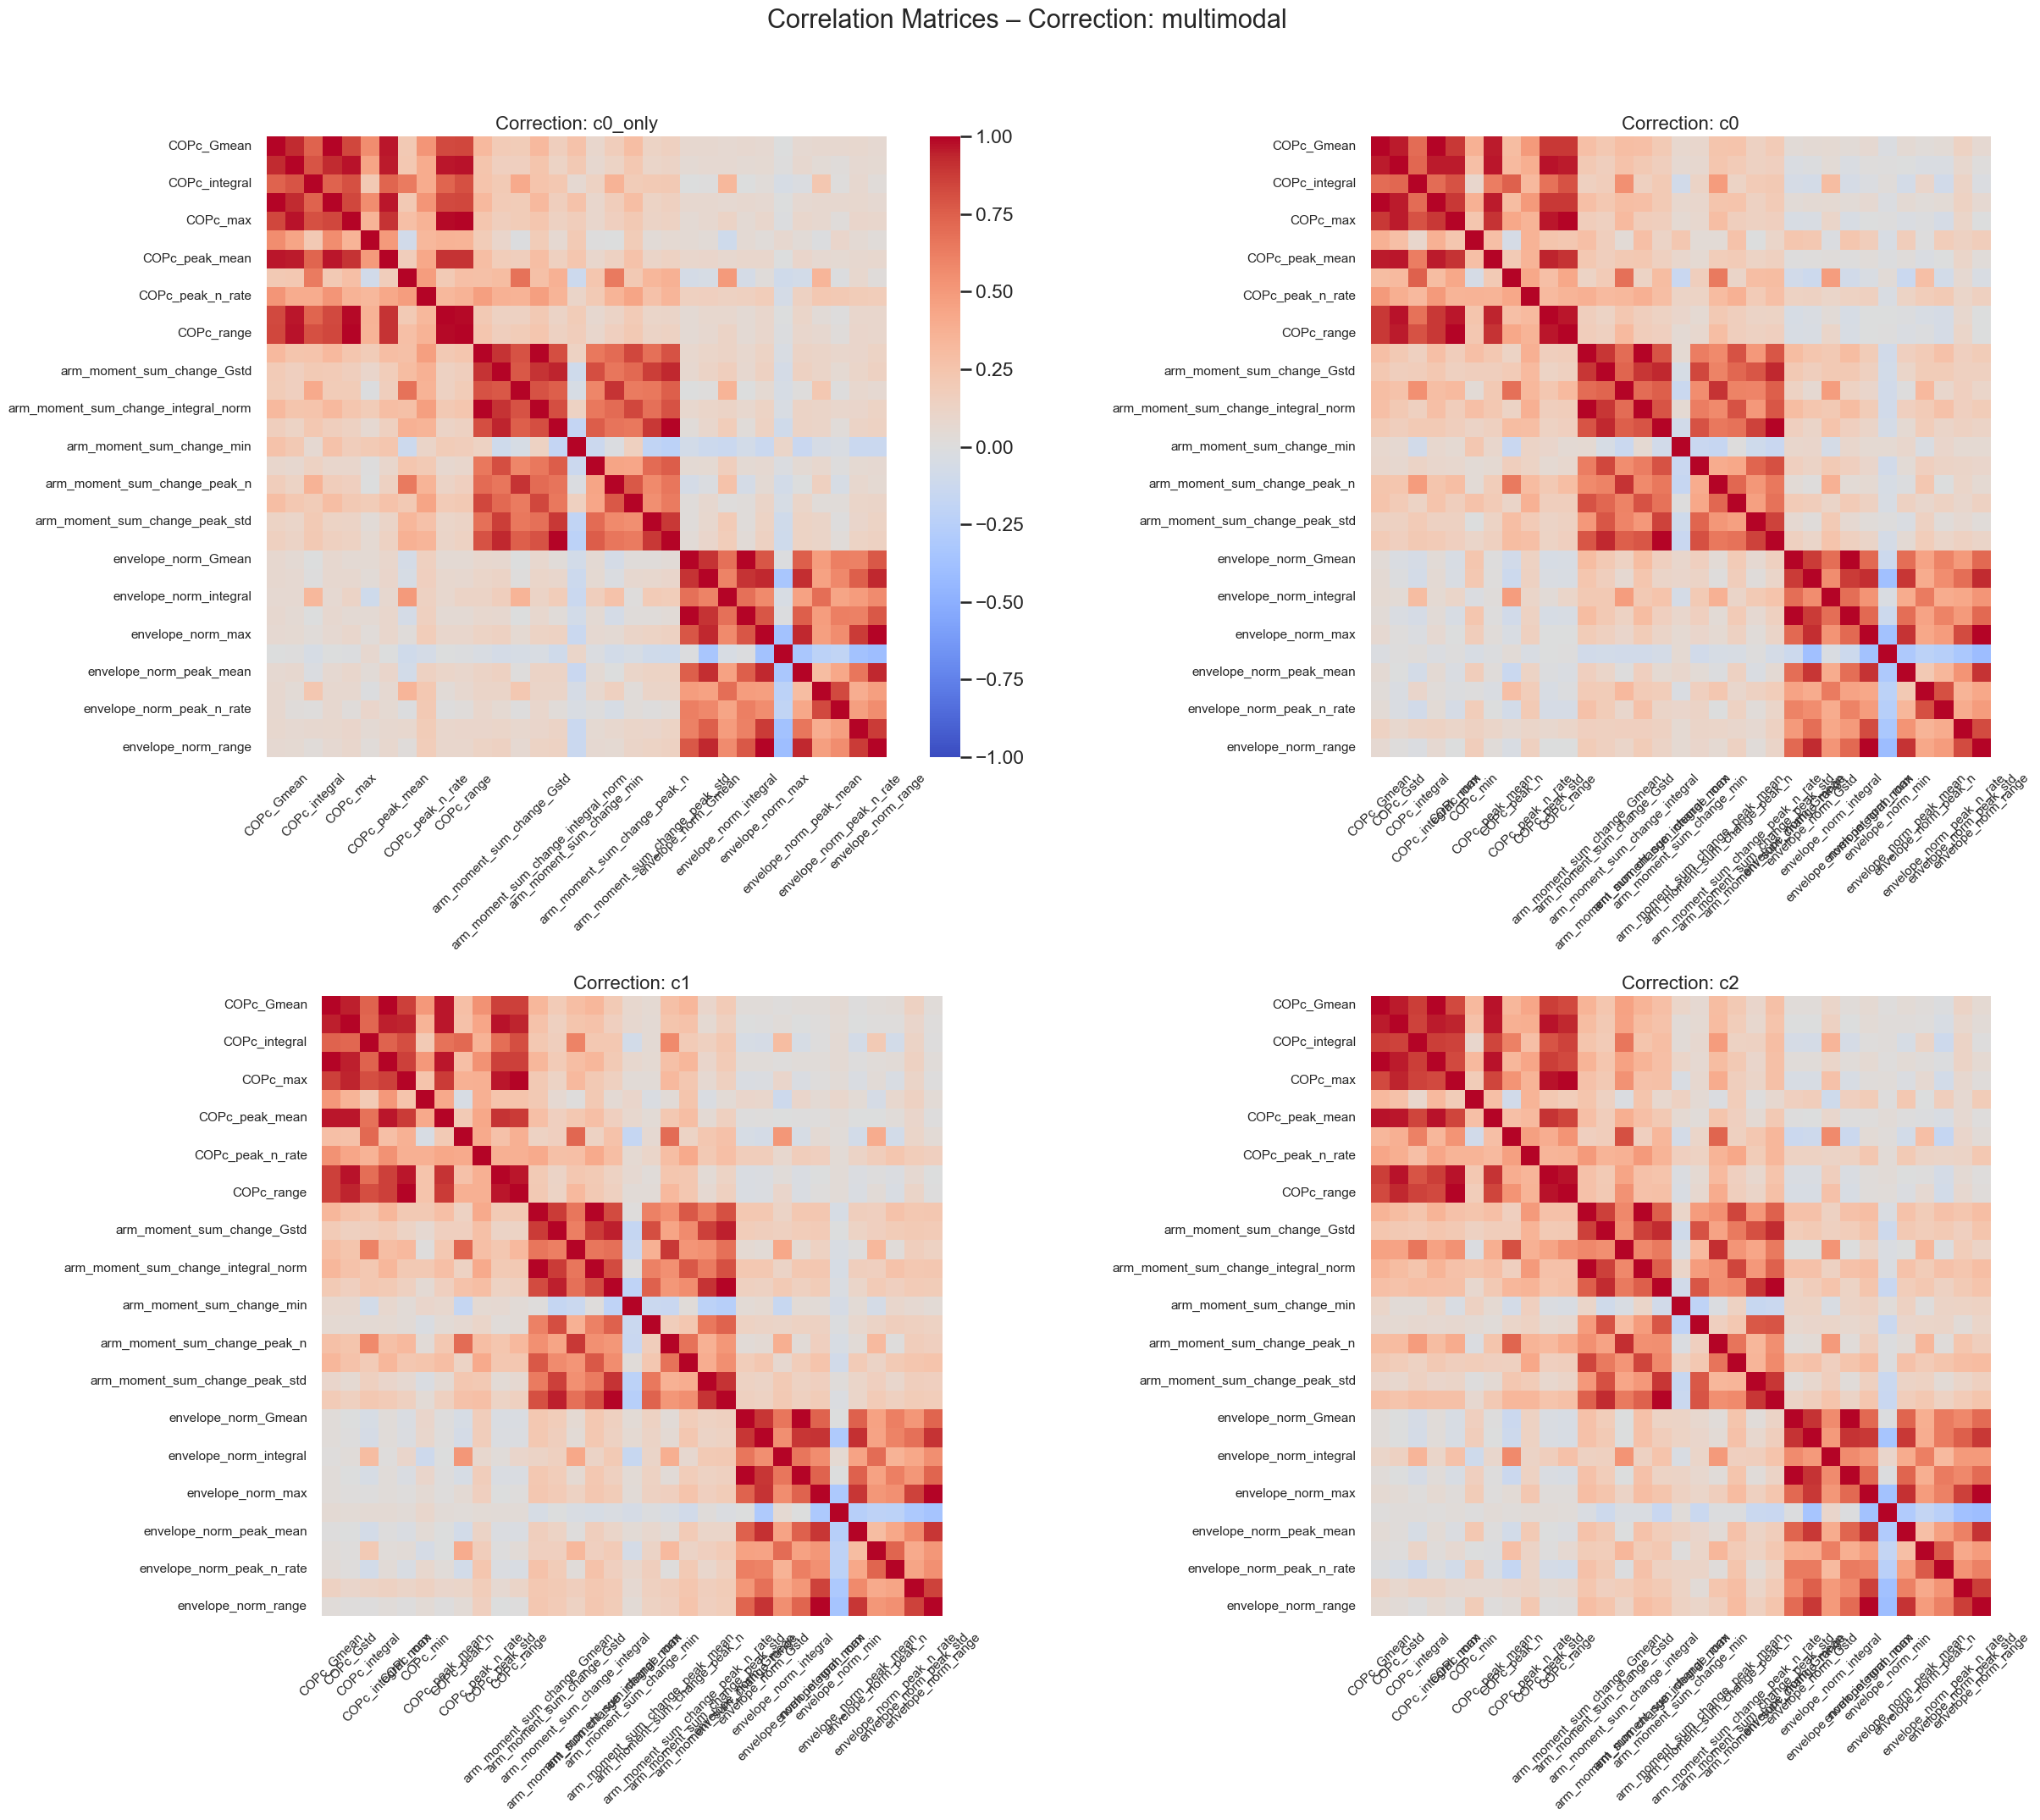
Correlation per modality & correction (heat map)

numeric_cols = subdf_n.select_dtypes(include=[np.number]).columns

desired_order = ["c0_only", "c0", "c1", "c2"]
corrections = [c for c in desired_order if c in subdf_n["correction_info"].unique()]

modalities = subdf_n["modality"].unique()

for modality in modalities:
    fig, axes = plt.subplots(2, 2, figsize=(26, 22))
    axes = axes.flatten()

    fig.suptitle(f"Correlation Matrices – Correction: {modality}", fontsize=22)

    for i, correction in enumerate(corrections):
        df_group = subdf_n[
            (subdf_n["correction_info"] == correction) &
            (subdf_n["modality"] == modality)
        ]

        subdf_numeric = df_group[numeric_cols]
        subdf_numeric = subdf_numeric.reindex(sorted(subdf_numeric.columns), axis=1)

        if len(subdf_numeric) < 3:
            axes[i].set_title(f"{correction}\n(too few samples)", fontsize=14)
            axes[i].axis("off")
            continue

        corr_matrix = subdf_numeric.corr()

        sns.heatmap(
            corr_matrix,
            cmap="coolwarm",
            vmin=-1,
            vmax=1,
            square=True,
            ax=axes[i],
            cbar=i == 0  # show colorbar only once per figure
        )

        axes[i].set_title(f"Correction: {correction}", fontsize=16)
        axes[i].tick_params(axis='x', labelsize=11, rotation=45)
        axes[i].tick_params(axis='y', labelsize=11)

    # hide unused subplots if <4 modalities
    for j in range(i + 1, 4):
        axes[j].axis("off")

    plt.tight_layout(rect=[0, 0, 1, 0.96])
    plt.show()

Correlation change per modality & correction

corr_results = []
numerical_cols = subdf_n_numeric.columns

for modality in subdf_n['modality'].unique():
    for correction in subdf_n['correction_info'].unique():
        subset = subdf_n[(subdf_n['modality'] == modality) & (subdf_n['correction_info'] == correction)]
        if len(subset) > 1:  # Ensure there are enough samples to calculate correlation
            corr_matrix = subset[numerical_cols].corr()
            for i, col1 in enumerate(numerical_cols):
                for col2 in numerical_cols[i+1:]:
                    corr_results.append({
                        'modality': modality,
                        'correction_info': correction,
                        'feature_1': col1,
                        'feature_2': col2,
                        'correlation': corr_matrix.loc[col1, col2]
                    })

corr_df = pd.DataFrame(corr_results)

# get rid of those that refer to the same feature by the first element (COPc_ and COPc_ for example)
corr_df['same_feature'] = corr_df.apply(lambda row: row['feature_1'].split('_')[0] == row['feature_2'].split('_')[0], axis=1)

# keep only those that do not refer to the same feature
corr_df = corr_df[~corr_df['same_feature']].drop(columns=['same_feature'])

# define which feature prefixes are irrelevant per modality
IRRELEVANT_BY_MODALITY = {
    "gesture": ["envelope_"],   # envelope_* is noise in gesture
    "vocal": ["arm_"],         # arm_* is irrelevant in vocal
}

def is_irrelevant(row):
    modality = row["modality"]
    f1 = row["feature_1"]
    f2 = row["feature_2"]

    irrelevant_prefixes = IRRELEVANT_BY_MODALITY.get(modality, [])

    return any(
        f1.startswith(pref) or f2.startswith(pref)
        for pref in irrelevant_prefixes
    )

corr_df = corr_df[~corr_df.apply(is_irrelevant, axis=1)].copy()

# remove c0_only
corr_df = corr_df[corr_df['correction_info'] != 'c0_only'].copy()

# enforce order
corr_df['correction_info'] = pd.Categorical(
    corr_df['correction_info'],
    categories=['c0', 'c1', 'c2'],
    ordered=True
)

# compute max change per pair per modality
delta_df = (
    corr_df
    .groupby(["modality", "feature_1", "feature_2"])["correlation"]
    .agg(lambda x: x.max() - x.min())
    .reset_index(name="delta")
)

# merge back
corr_df = corr_df.merge(delta_df, on=["modality", "feature_1", "feature_2"])

# threshold for "no meaningful change"
EPS = 0.05  # tune this
corr_df["changes"] = corr_df["delta"] > EPS

corr_df = corr_df.sort_values(
    ["modality", "feature_1", "feature_2", "correction_info", "delta", "changes"]
)

corr_df["pair"] = corr_df["feature_1"] + " Ă— " + corr_df["feature_2"]
fig = px.line(
    corr_df,
    x="correction_info",
    y="correlation",
    color="pair",
    facet_col="modality",
    hover_data={
        "feature_1": True,
        "feature_2": True,
        "correction_info": True,
        "correlation": ":.3f",
        "delta": ":.3f",
    },
    markers=True
)

fig.update_layout(
    height=650,
    title="Correlation trajectories across corrections (c0 → c1 → c2)",
    legend_title_text="Feature pairs",
)

for trace in fig.data:
    # trace.name == pair label
    pair_name = trace.name

    # check if this pair changes in ANY modality facet
    is_changing = (
        corr_df[corr_df["pair"] == pair_name]["changes"]
        .any()
    )

    if not is_changing:
        trace.line.color = "rgba(150,150,150,0.2)"
        trace.marker.opacity = 0.2
        trace.line.width = 1
    else:
        trace.line.width = 2.5

# horizontal dashed line at y =3
fig.add_hline(y=0.3, line_dash="dash", line_color="black", opacity=0.5)
fig.add_hline(y=-0.3, line_dash="dash", line_color="black", opacity=0.5)

fig.update_layout(showlegend=False)
fig.update_xaxes(categoryorder="array", categoryarray=["c0", "c1", "c2"])
fig.show()
Unable to display output for mime type(s): application/vnd.plotly.v1+json

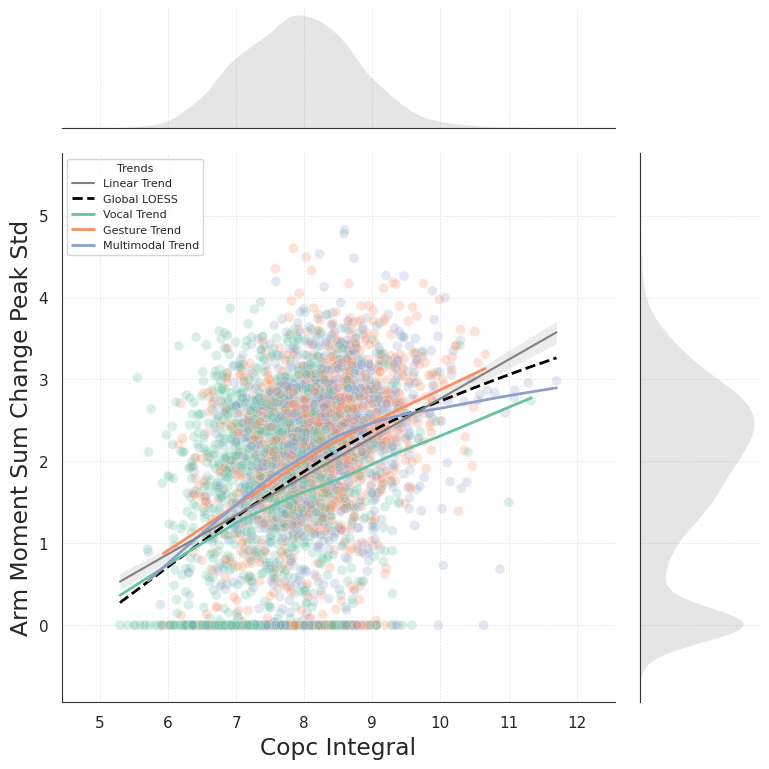
Scatter plot for chosen variables

# plot relationship of COPc_integral and arm_moment_sum_change_peak_std
features_df = pd.read_csv(os.path.join(datafolder, "features_df_nonzscored_final.csv"))

# log- transform cop
features_df['COPc_integral'] = np.log(features_df['COPc_integral'] + 1)
# log-transform arm_moment_sum_change_peak_std
features_df['arm_moment_sum_change_peak_std'] = np.log(features_df['arm_moment_sum_change_peak_std'] + 1)

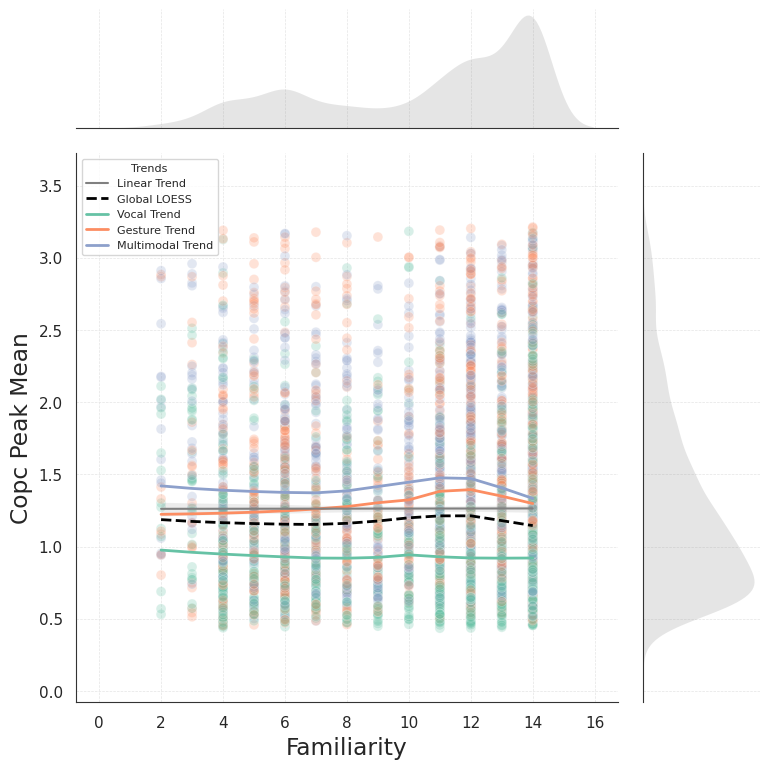
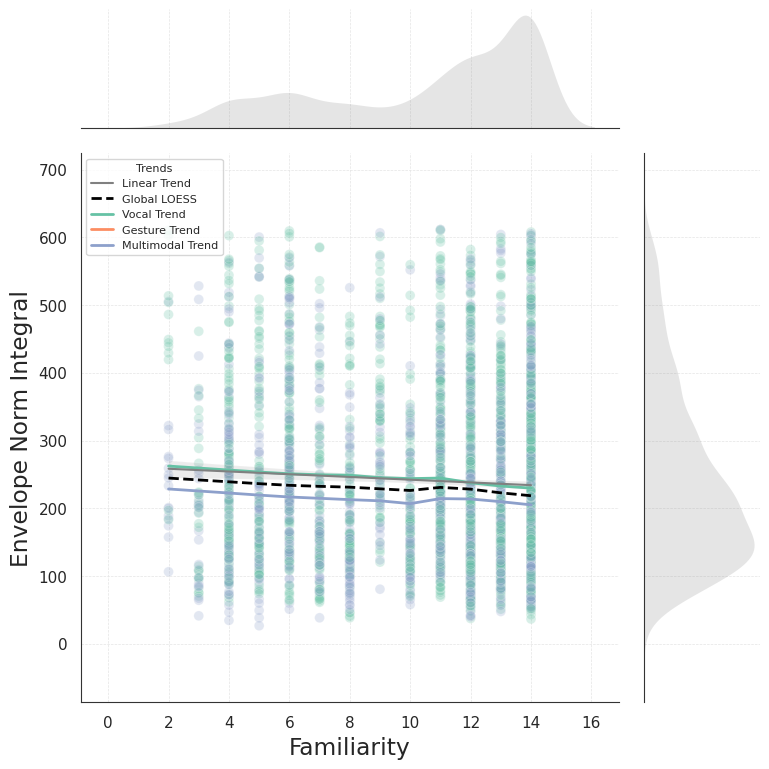
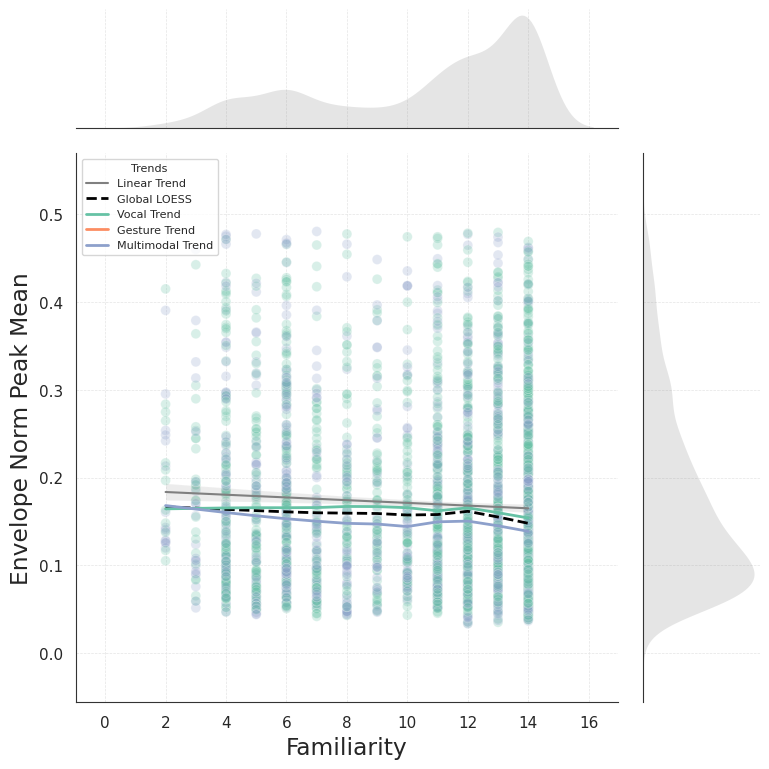
plot_relationship(features_df, 
                  x_var='COPc_integral', 
                  y_var='arm_moment_sum_change_peak_std')

Basic viz

How many trials we have per correction (4 levels) and modality (3 levels)

features_df = pd.read_csv(os.path.join(datafolder, "features_df_nonzscored_final.csv"))
correction_modality_counts = features_df.groupby(['correction_info', 'modality']).size().reset_index(name='counts')
print(correction_modality_counts)
   correction_info    modality  counts
0               c0     gesture     327
1               c0  multimodal     327
2               c0       vocal     603
3          c0_only     gesture     368
4          c0_only  multimodal     375
5          c0_only       vocal     200
6               c1     gesture     349
7               c1  multimodal     351
8               c1       vocal     611
9               c2     gesture     200
10              c2  multimodal     198
11              c2       vocal     519

How many unique dyads and participants we have per correction level+modality

features_df = pd.read_csv(os.path.join(datafolder, "features_df_nonzscored_final.csv"))
features_df['dyad_id'] = features_df['TrialID'].str.split('_').str[:2].str.join('_')
features_df['pcn_id'] = features_df['TrialID'].str.split('_').str[:2].str.join('_') + '_' + features_df['TrialID'].str.split('_').str[3]

# how many unique dyads and participants we have per correction level+modality
unique_counts = features_df.groupby(['correction_info', 'modality']).agg(
    unique_dyads=pd.NamedAgg(column='dyad_id', aggfunc=lambda x: x.nunique()),
    unique_participants=pd.NamedAgg(column='pcn_id', aggfunc=lambda x: x.nunique())
).reset_index()
print(unique_counts)
   correction_info    modality  unique_dyads  unique_participants
0               c0     gesture            61                  112
1               c0  multimodal            61                  117
2               c0       vocal            61                  121
3          c0_only     gesture            61                  118
4          c0_only  multimodal            61                  119
5          c0_only       vocal            59                  102
6               c1     gesture            61                  116
7               c1  multimodal            61                  117
8               c1       vocal            61                  121
9               c2     gesture            60                  101
10              c2  multimodal            57                  102
11              c2       vocal            61                  120

This is the duration of trials per modality and correction

import warnings
warnings.filterwarnings("ignore", category=FutureWarning, module="ptitprince")

features_df = pd.read_csv(os.path.join(datafolder, "features_df_nonzscored_final.csv"))

features_df = features_df[~features_df['expressibility'].isna()]
var = 'duration_trial'
var_to_display = 'Trial Duration (in ms)'

# Remove outliers using Tukey method
Q1 = features_df[var].quantile(0.25)
Q3 = features_df[var].quantile(0.75)
IQR = Q3 - Q1
lower_bound = Q1 - 1.5 * IQR
upper_bound = Q3 + 1.5 * IQR

cleaned_data = features_df[
    (features_df[var] >= lower_bound) &
    (features_df[var] <= upper_bound)
].copy()

# how much was removed?
removed_percentage = 100 * (1 - len(cleaned_data) / len(features_df))
print(f"Removed {removed_percentage:.2f}% of data as outliers based on {var}.")

# Ensure correct order of correction_info
correction_order = ['c0_only', 'c0', 'c1', 'c2']
cleaned_data['correction_info'] = pd.Categorical(
    cleaned_data['correction_info'],
    categories=correction_order,
    ordered=True
)

sns.set_context("talk")  # Larger font scale
sns.set_style("whitegrid", {'axes.grid': True, 'grid.linestyle': '--'})
custom_palette = sns.color_palette("Set2")

# Create the plot
plt.figure(figsize=(12, 7))
ax = pt.RainCloud(
    x='correction_info',
    y=var,
    hue='modality',
    data=cleaned_data,
    palette=modality_palette,
    width_viol=0.6,
    width_box=0.15,
    move=0.15,
    orient='v',
    bw=0.2,
    alpha=0.5,
    dodge=True,
    pointplot=True
)

# calculate mean of gesture, c0
mean_c0_mult = cleaned_data[(cleaned_data['correction_info'] == 'c0') & (cleaned_data['modality'] == 'multimodal')][var].mean()
mean_c0_ges = cleaned_data[(cleaned_data['correction_info'] == 'c0') & (cleaned_data['modality'] == 'gesture')][var].mean()
mean_c0_voc = cleaned_data[(cleaned_data['correction_info'] == 'c0') & (cleaned_data['modality'] == 'vocal')][var].mean()

# following the modality palette, create two horizontal dashed lines
plt.axhline(mean_c0_mult, color=modality_palette['multimodal'], linestyle='--', linewidth=1.5, label='Mean C0 Multimodal')
plt.axhline(mean_c0_ges, color=modality_palette['gesture'], linestyle='--', linewidth=1.5, label='Mean C0 Gesture')
plt.axhline(mean_c0_voc, color=modality_palette['vocal'], linestyle='--', linewidth=1.5, label='Mean C0 Vocal')

# Title and labels 
plt.title(f"{var_to_display} by Correction Info and Modality", fontsize=18, weight='bold', pad=20)
plt.xlabel("", fontsize=14)
plt.ylabel(var, fontsize=14)

# Axis tweaks 
plt.xticks(fontsize=12)
plt.yticks(fontsize=12)
plt.grid(True, axis='y', linestyle='--', linewidth=0.5, alpha=0.6)
plt.gca().set_facecolor("white")
plt.gcf().patch.set_facecolor('white')

plt.tight_layout()
plt.show()
Removed 4.99% of data as outliers based on duration_trial.

Variables compared across z-scored and non-zscored versions

Torque integral

# plot distribution arm_moment_sum_change_integral on non-zscored data
features_df = pd.read_csv(os.path.join(datafolder, "features_df_nonzscored_final.csv"))
features_df['arm_moment_sum_change_integral'] = np.log(features_df['arm_moment_sum_change_integral'] + 1)

sns.set_context("talk")  # Larger font scale
sns.set_style("whitegrid", {'axes.grid': True, 'grid.linestyle': '--'})
plt.figure(figsize=(12, 7))
sns.kdeplot(
    data=features_df,
    x='arm_moment_sum_change_integral',
    hue='modality',
    palette=modality_palette,
    fill=True,
    common_norm=False,
    alpha=0.5
)

All trials

features_df_nonz = pd.read_csv(os.path.join(datafolder, "features_df_nonzscored_final.csv"))
features_df_z = pd.read_csv(os.path.join(datafolder, "features_df_zscored_feat_final.csv"))

plot_raincloud_comparison(features_df_nonz, features_df_z, var='arm_moment_sum_change_integral', var_to_display='Torque Change Integral (Nm)', log_transform=True, modalityout='vocal', correctionout='c0_only')
Removed 7.01% of data as outliers based on Torque Change Integral (Nm).
Percentage of z-scored data removed:  5.21015761821366

Only succesful trials

features_df_nonz = pd.read_csv(os.path.join(datafolder, "features_df_nonzscored_final.csv"))
features_df_z = pd.read_csv(os.path.join(datafolder, "features_df_zscored_feat_final.csv"))

# in concept_id, add the first element from TrialID before all the elements
features_df_nonz['concept_id'] = features_df_nonz['TrialID'].str.split('_').str[0] + '_' + features_df_nonz['concept_id']

# for eacg concept_id, check if the last correction available (c0, c1, c2) has answer_fol_dist 1, if yes, put in the column overal_success 1, else 0
def check_overall_success(group):
    # order the correction_info by the desired order
    correction_order = ['c0', 'c1', 'c2']
    group = group.sort_values('correction_info', key=lambda x: x.map({c: i for i, c in enumerate(correction_order)}))
    last_correction = group['correction'].iloc[-1]
    # check if answer_fol_dist is 1 in the last correction
    if group[group['correction'] == last_correction]['answer_fol_dist'].iloc[0] == 1:
        # put 1 to all rows of the group in overall_success
        return 1
    else:        
        return 0
    
for concept_id, group in features_df_nonz.groupby('concept_id'):
    overall_success = check_overall_success(group)
    features_df_nonz.loc[group.index, 'overall_success'] = overall_success

for concept_id, group in features_df_z.groupby('concept_id'):
    overall_success = check_overall_success(group)
    features_df_z.loc[group.index, 'overall_success'] = overall_success

# now plot rainbow plot only for overall_success == 1
plot_raincloud_comparison(features_df_nonz[features_df_nonz['overall_success'] == 1], features_df_z[features_df_z['overall_success'] == 1], var='arm_moment_sum_change_integral', var_to_display='Torque Change Integral (Nm)', log_transform=True, modalityout='vocal', correctionout='c0_only')
Removed 7.13% of data as outliers based on Torque Change Integral (Nm).
Percentage of z-scored data removed:  5.545774647887324

Group by participant (dot=mean)

# plot but create mean for one participant
features_df_nonz = pd.read_csv(os.path.join(datafolder, "features_df_nonzscored_final.csv"))
features_df_z = pd.read_csv(os.path.join(datafolder, "features_df_zscored_feat_final.csv"))


# create column pcn_id which is first two elements sep by _ of TrialID + 4th
features_df_nonz['pcn_id'] = features_df_nonz['TrialID'].str.split('_').str[:2].str.join('_') + '_' + features_df_nonz['TrialID'].str.split('_').str[3]
features_df_z['pcn_id'] = features_df_z['TrialID'].str.split('_').str[:2].str.join('_') + '_' + features_df_z['TrialID'].str.split('_').str[3]

# group by pcn_id, modality, correction_info and take mean of arm_moment_sum_change_integral
features_df_nonz_grouped = features_df_nonz.groupby(['pcn_id', 'modality', 'correction_info'])['arm_moment_sum_change_integral'].mean().reset_index()
features_df_z_grouped = features_df_z.groupby(['pcn_id', 'modality', 'correction_info'])['arm_moment_sum_change_integral'].mean().reset_index()

plot_raincloud_comparison(features_df_nonz_grouped, features_df_z_grouped, var='arm_moment_sum_change_integral', var_to_display='Torque Change Integral (Nm)', log_transform=True, modalityout='vocal', correctionout='c0_only')
Removed 5.69% of data as outliers based on Torque Change Integral (Nm).
Percentage of z-scored data removed:  3.8406827880512093

Group by concept (dot=mean)

features_df_nonz = pd.read_csv(os.path.join(datafolder, "features_df_nonzscored_final.csv"))
features_df_z = pd.read_csv(os.path.join(datafolder, "features_df_zscored_feat_final.csv"))

features_df_nonz_grouped = features_df_nonz.groupby(['concept', 'modality', 'correction_info'])['arm_moment_sum_change_integral'].mean().reset_index()
features_df_z_grouped = features_df_z.groupby(['concept', 'modality', 'correction_info'])['arm_moment_sum_change_integral'].mean().reset_index()

plot_raincloud_comparison(features_df_nonz_grouped, features_df_z_grouped, var='arm_moment_sum_change_integral', var_to_display='Torque Change Integral (Nm)', log_transform=True, modalityout='vocal', correctionout='c0_only')
Removed 3.12% of data as outliers based on Torque Change Integral (Nm).
Percentage of z-scored data removed:  4.086538461538462

Torque integral (normalized by time)

features_df_nonz = pd.read_csv(os.path.join(datafolder, "features_df_nonzscored_final.csv"))
features_df_z = pd.read_csv(os.path.join(datafolder, "features_df_zscored_feat_final.csv"))

plot_raincloud_comparison(features_df_nonz, features_df_z, var='arm_moment_sum_change_integral_norm', var_to_display='Torque Change Integral (time-normalized)', log_transform=False, modalityout='vocal', correctionout='c0_only')
Removed 5.25% of data as outliers based on Torque Change Integral (time-normalized).
Percentage of z-scored data removed:  4.903677758318739

Torque sd

features_df_nonz = pd.read_csv(os.path.join(datafolder, "features_df_nonzscored_final.csv"))
features_df_z = pd.read_csv(os.path.join(datafolder, "features_df_zscored_feat_final.csv"))

plot_raincloud_comparison(features_df_nonz, features_df_z, var='arm_moment_sum_change_Gstd', var_to_display='Torque Change SD (Nm)', log_transform=False, modalityout='vocal', correctionout='c0_only')
Removed 6.00% of data as outliers based on Torque Change SD (Nm).
Percentage of z-scored data removed:  4.772329246935201

Torque pospeak mean

All trials

features_df_nonz = pd.read_csv(os.path.join(datafolder, "features_df_nonzscored_final.csv"))

sns.set_context("talk")  # Larger font scale
sns.set_style("whitegrid", {'axes.grid': True, 'grid.linestyle': '--'})
plt.figure(figsize=(12, 7))
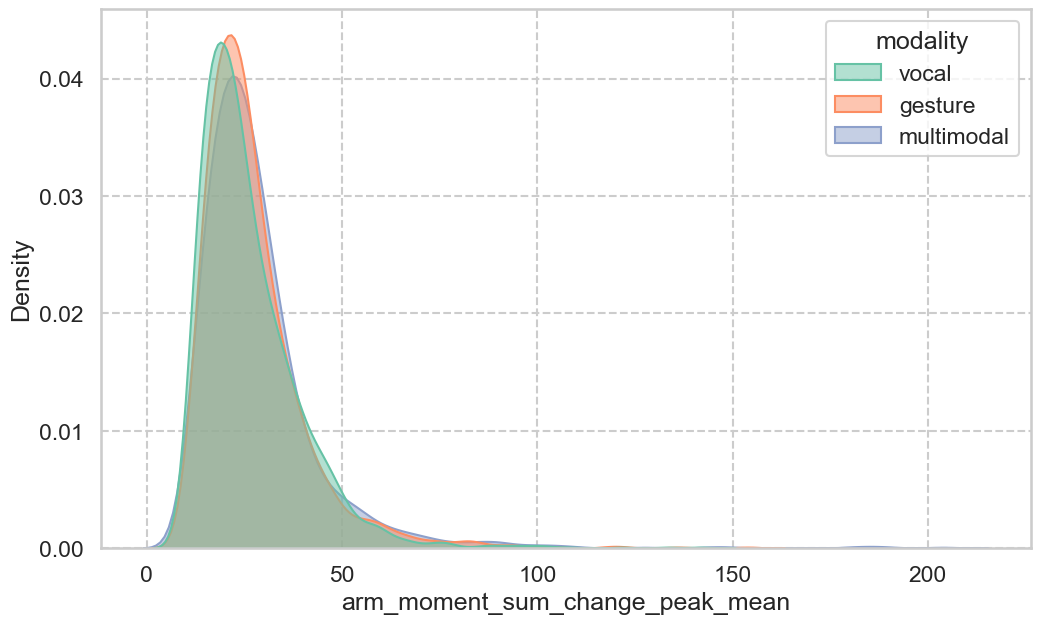
sns.kdeplot(
    data=features_df_nonz,
    x='arm_moment_sum_change_peak_mean',
    hue='modality',
    palette=modality_palette,
    fill=True,
    common_norm=False,
    alpha=0.5
)

features_df_nonz = pd.read_csv(os.path.join(datafolder, "features_df_nonzscored_final.csv"))
features_df_z = pd.read_csv(os.path.join(datafolder, "features_df_zscored_feat_final.csv"))

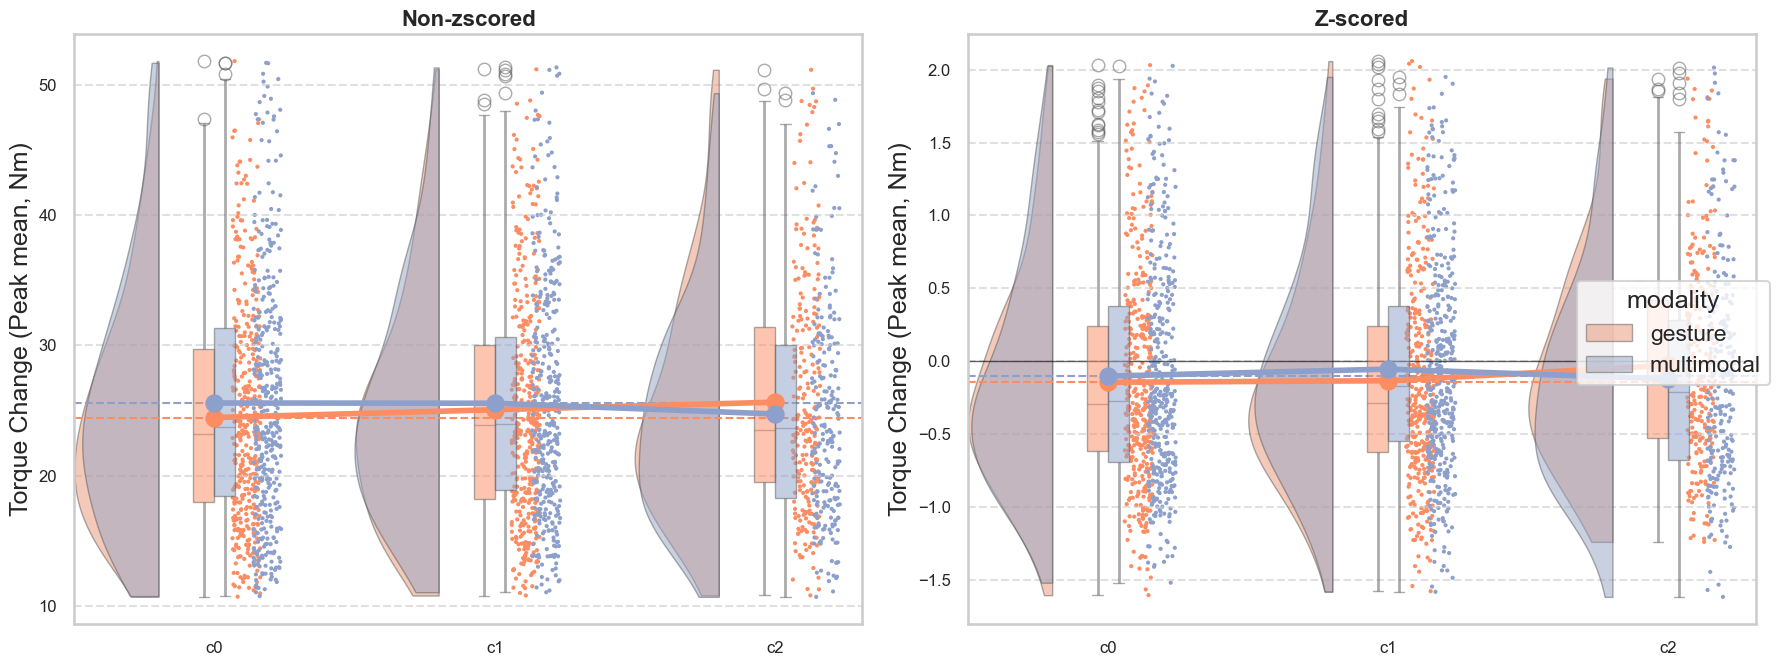
plot_raincloud_comparison(features_df_nonz, features_df_z, var='arm_moment_sum_change_peak_mean', var_to_display='Torque Change (Peak mean, Nm)', log_transform=False, modalityout='vocal', correctionout='c0_only')
Removed 9.59% of data as outliers based on Torque Change (Peak mean, Nm).
Percentage of z-scored data removed:  8.712784588441332

Succesful trials

def check_overall_success(group):
    """Check if the last correction in a group has answer_fol_dist equal to 1.
    If true, returns 1 for all rows in the group; otherwise returns 0.

    Args:
        group (pd.DataFrame): DataFrame group containing correction information

    Returns:
        int: 1 if last correction's answer_fol_dist is 1, 0 otherwise
    """
    correction_order = ['c0', 'c1', 'c2']
    group = group.sort_values('correction_info', key=lambda x: x.map({c: i for i, c in enumerate(correction_order)}))
    last_correction = group['correction'].iloc[-1]
    if group[group['correction'] == last_correction]['answer_fol_dist'].iloc[0] == 1:
        return 1
    else:
        return 0
    
features_df_nonz = pd.read_csv(os.path.join(datafolder, "features_df_nonzscored_final.csv"))
features_df_z = pd.read_csv(os.path.join(datafolder, "features_df_zscored_feat_final.csv"))

# in concept_id, add the first element from TrialID before all the elements
features_df_nonz['concept_id'] = features_df_nonz['TrialID'].str.split('_').str[0] + '_' + features_df_nonz['concept_id']

for concept_id, group in features_df_nonz.groupby('concept_id'):
    overall_success = check_overall_success(group)
    features_df_nonz.loc[group.index, 'overall_success'] = overall_success

for concept_id, group in features_df_z.groupby('concept_id'):
    overall_success = check_overall_success(group)
    features_df_z.loc[group.index, 'overall_success'] = overall_success

# now plot raincloud plot only for overall_success == 1
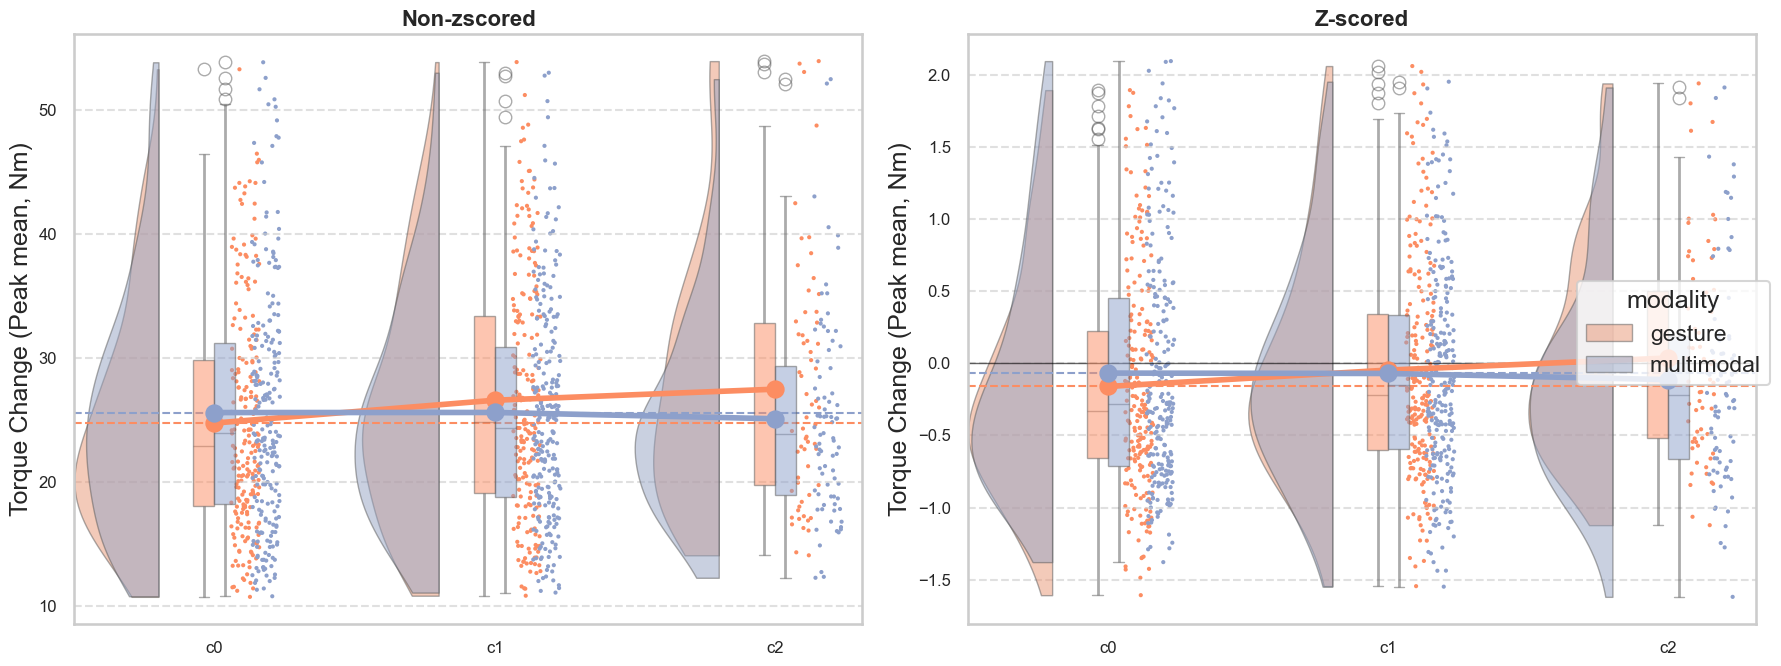
plot_raincloud_comparison(features_df_nonz[features_df_nonz['overall_success'] == 1], features_df_z[features_df_z['overall_success'] == 1], var='arm_moment_sum_change_peak_mean', var_to_display='Torque Change (Peak mean, Nm)', log_transform=False, modalityout='vocal', correctionout='c0_only')
Removed 8.71% of data as outliers based on Torque Change (Peak mean, Nm).
Percentage of z-scored data removed:  8.01056338028169

Torque peak std

features_df_nonz = pd.read_csv(os.path.join(datafolder, "features_df_nonzscored_final.csv"))
features_df_z = pd.read_csv(os.path.join(datafolder, "features_df_zscored_feat_final.csv"))

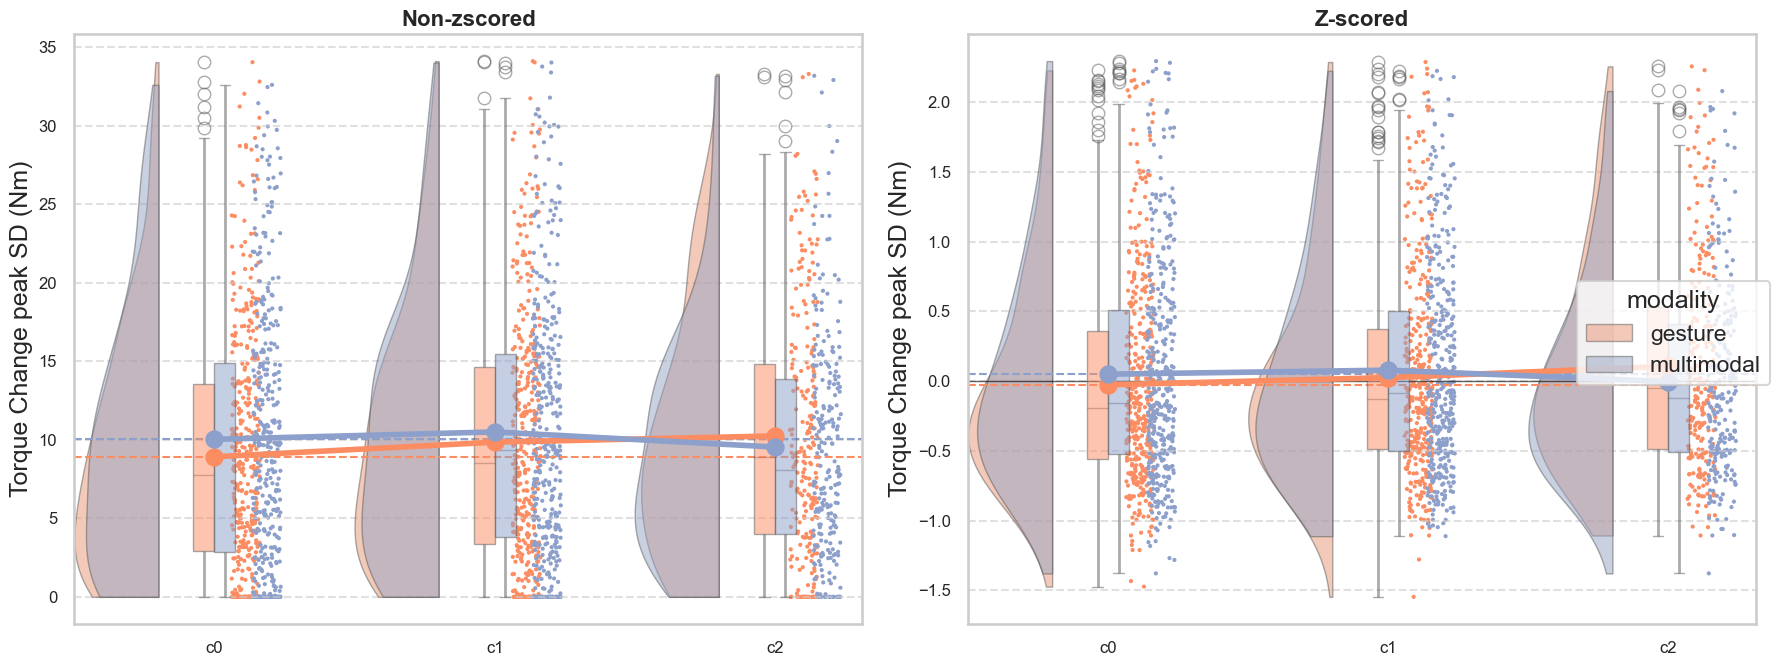
plot_raincloud_comparison(features_df_nonz, features_df_z, var='arm_moment_sum_change_peak_std', var_to_display='Torque Change peak SD (Nm)', log_transform=False, modalityout='vocal', correctionout='c0_only')
Removed 10.55% of data as outliers based on Torque Change peak SD (Nm).
Percentage of z-scored data removed:  8.756567425569177

Torque peak n

features_df_nonz = pd.read_csv(os.path.join(datafolder, "features_df_nonzscored_final.csv"))
features_df_z = pd.read_csv(os.path.join(datafolder, "features_df_zscored_feat_final.csv"))

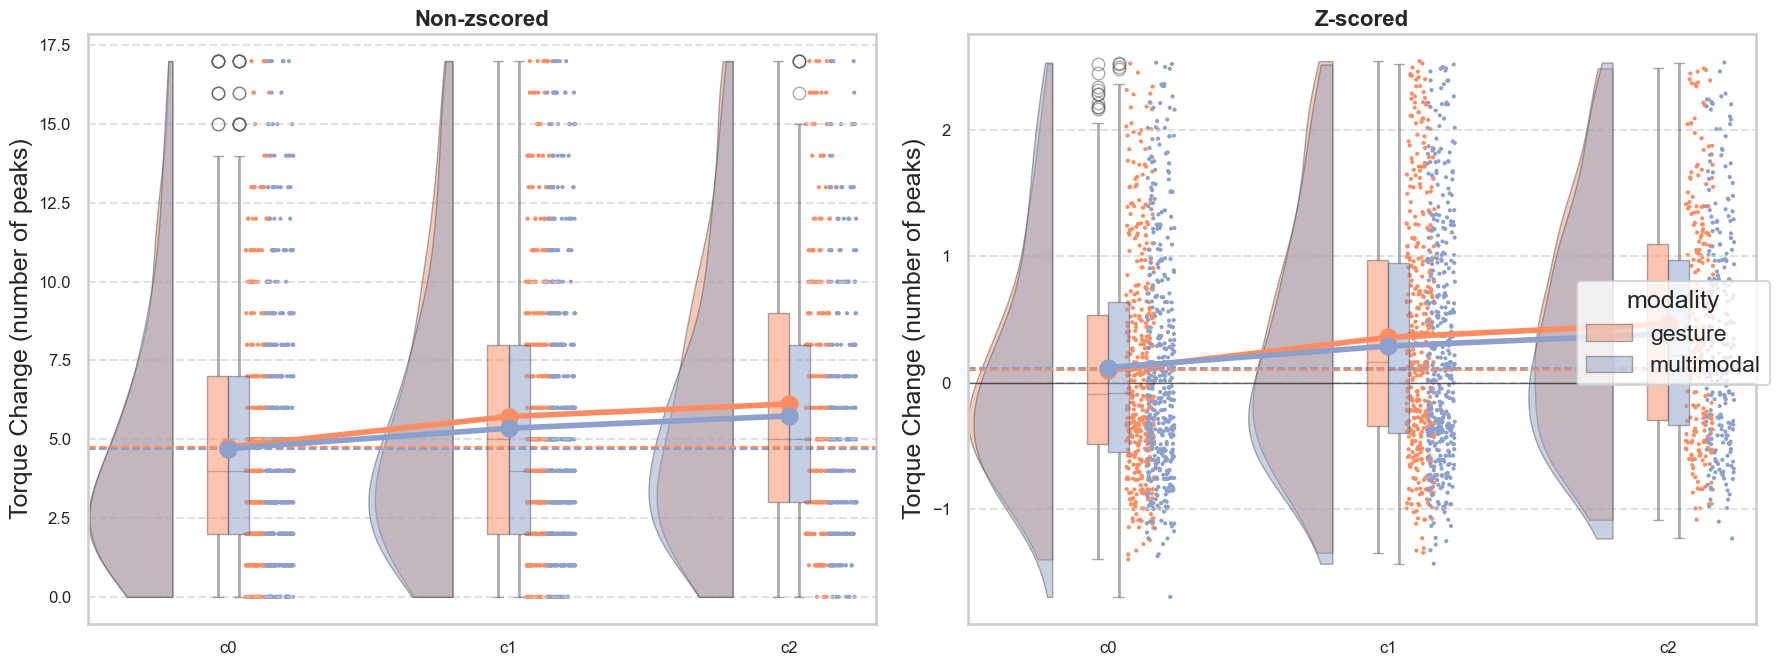
plot_raincloud_comparison(features_df_nonz, features_df_z, var='arm_moment_sum_change_peak_n', var_to_display='Torque Change (number of peaks)', log_transform=False, modalityout='vocal', correctionout='c0_only')
Removed 4.68% of data as outliers based on Torque Change (number of peaks).
Percentage of z-scored data removed:  4.684763572679509

Amplitude envelope integral

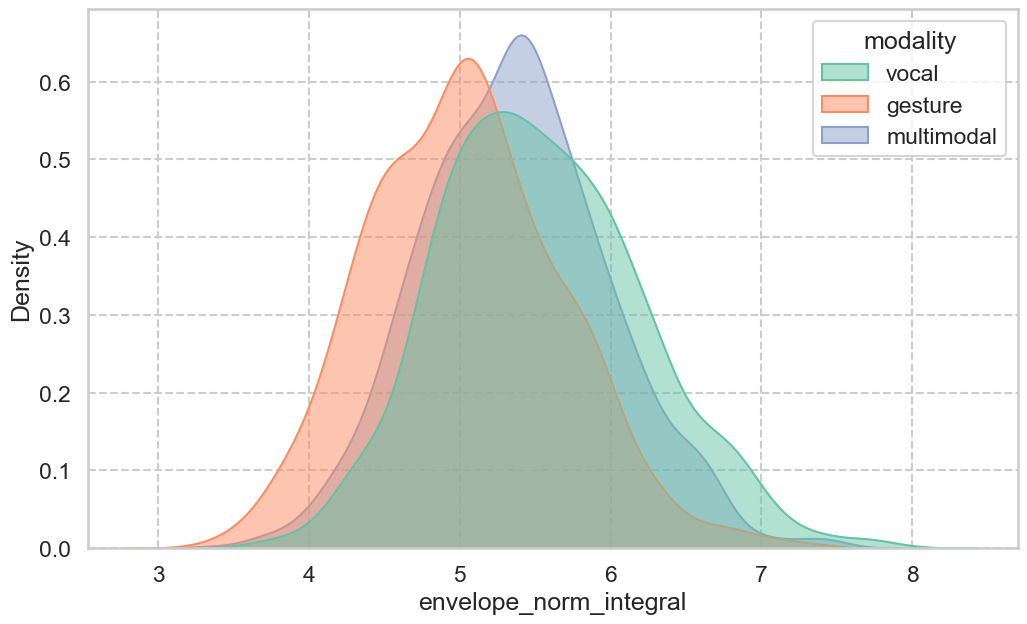
features_df_nonz = pd.read_csv(os.path.join(datafolder, "features_df_nonzscored_final.csv"))
features_df_nonz['envelope_norm_integral'] = np.log(features_df_nonz['envelope_norm_integral'] + 1)

sns.set_context("talk")  # Larger font scale
sns.set_style("whitegrid", {'axes.grid': True, 'grid.linestyle': '--'})
plt.figure(figsize=(12, 7))
sns.kdeplot(
    data=features_df_nonz,
    x='envelope_norm_integral',
    hue='modality',
    palette=modality_palette,
    fill=True,
    common_norm=False,
    alpha=0.5
)

All trials

features_df_nonz = pd.read_csv(os.path.join(datafolder, "features_df_nonzscored_final.csv"))
features_df_z = pd.read_csv(os.path.join(datafolder, "features_df_zscored_feat_final.csv"))

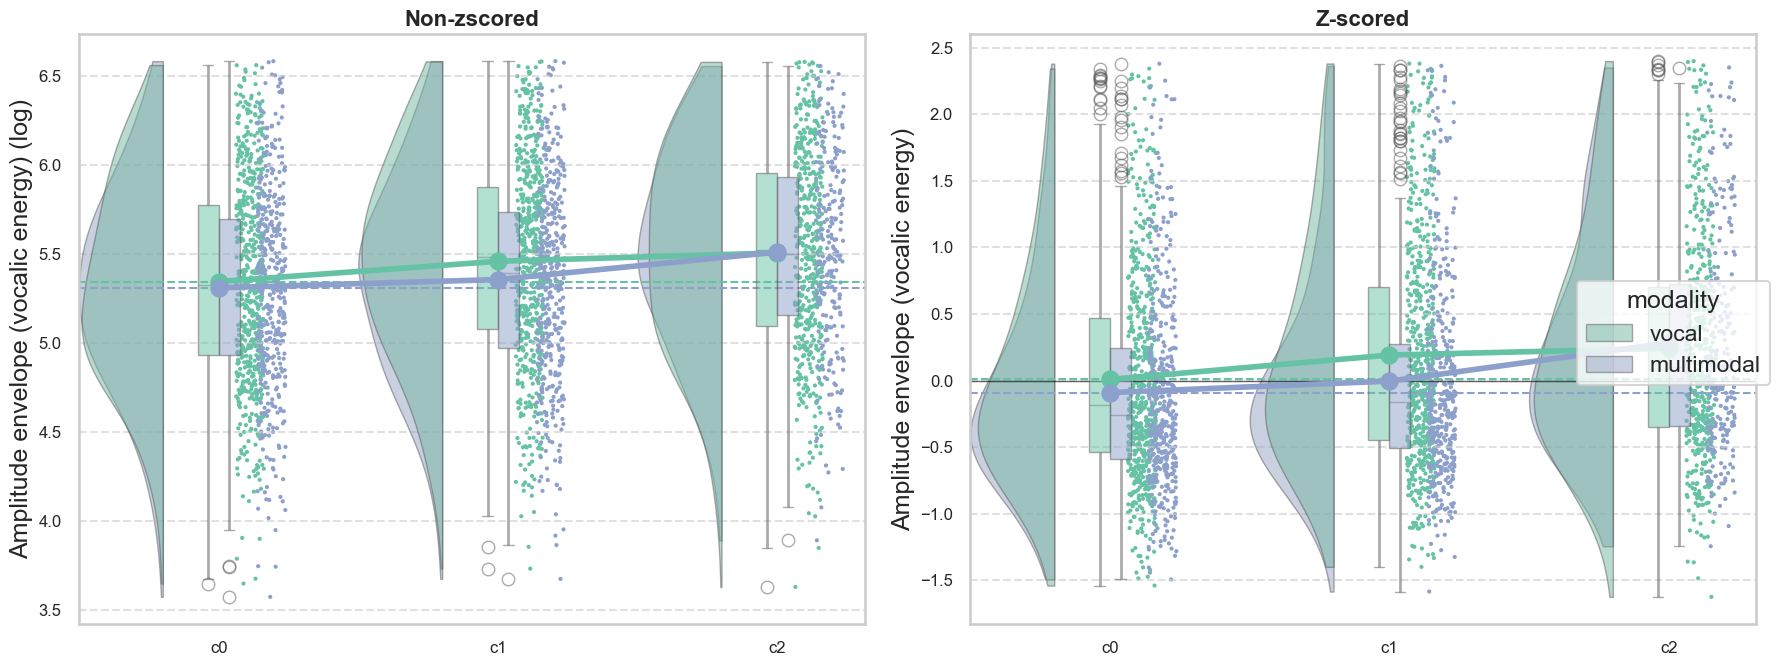
plot_raincloud_comparison(features_df_nonz, features_df_z, var='envelope_norm_integral', var_to_display='Amplitude envelope (vocalic energy)', log_transform=True, modalityout='gesture', correctionout='c0_only')
Removed 6.61% of data as outliers based on Amplitude envelope (vocalic energy).
Percentage of z-scored data removed:  5.2385719052385715

Succesfull trials

features_df_nonz = pd.read_csv(os.path.join(datafolder, "features_df_nonzscored_final.csv"))
features_df_z = pd.read_csv(os.path.join(datafolder, "features_df_zscored_feat_final.csv"))

features_df_nonz['concept_id'] = features_df_nonz['TrialID'].str.split('_').str[0] + '_' + features_df_nonz['concept_id']
    
for concept_id, group in features_df_nonz.groupby('concept_id'):
    overall_success = check_overall_success(group)
    features_df_nonz.loc[group.index, 'overall_success'] = overall_success

for concept_id, group in features_df_z.groupby('concept_id'):
    overall_success = check_overall_success(group)
    features_df_z.loc[group.index, 'overall_success'] = overall_success

# now plot raincloud plot only for overall_success == 1
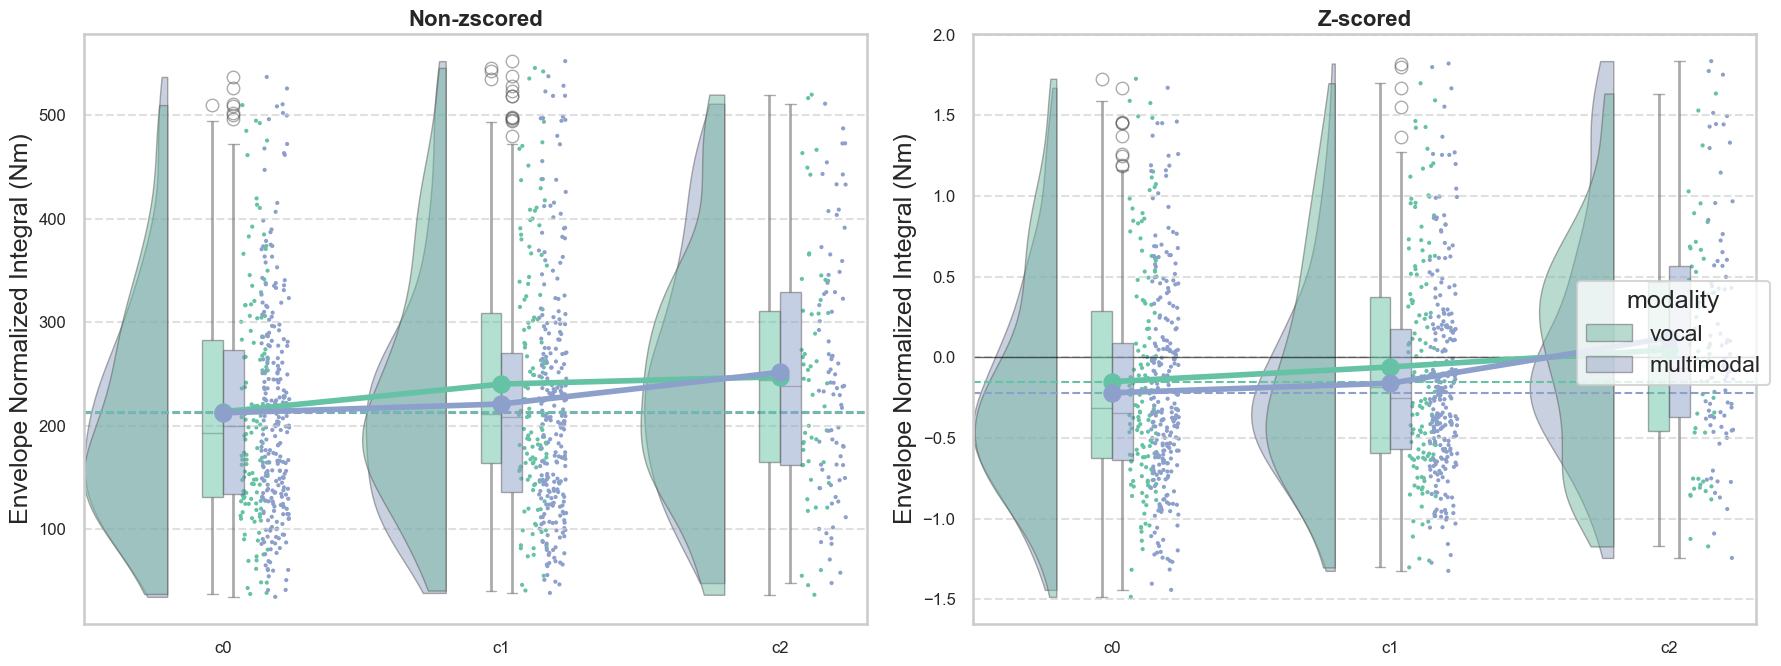
plot_raincloud_comparison(features_df_nonz[features_df_nonz['overall_success'] == 1], features_df_z[features_df_z['overall_success'] == 1], var='envelope_norm_integral', var_to_display='Envelope Normalized Integral (Nm)', log_transform=False, modalityout='gesture', correctionout='c0_only')
Removed 6.32% of data as outliers based on Envelope Normalized Integral (Nm).
Percentage of z-scored data removed:  5.578947368421053

Amplitude envelope integral (normalized by time)

features_df_nonz = pd.read_csv(os.path.join(datafolder, "features_df_nonzscored_final.csv"))
features_df_z = pd.read_csv(os.path.join(datafolder, "features_df_zscored_feat_final.csv"))

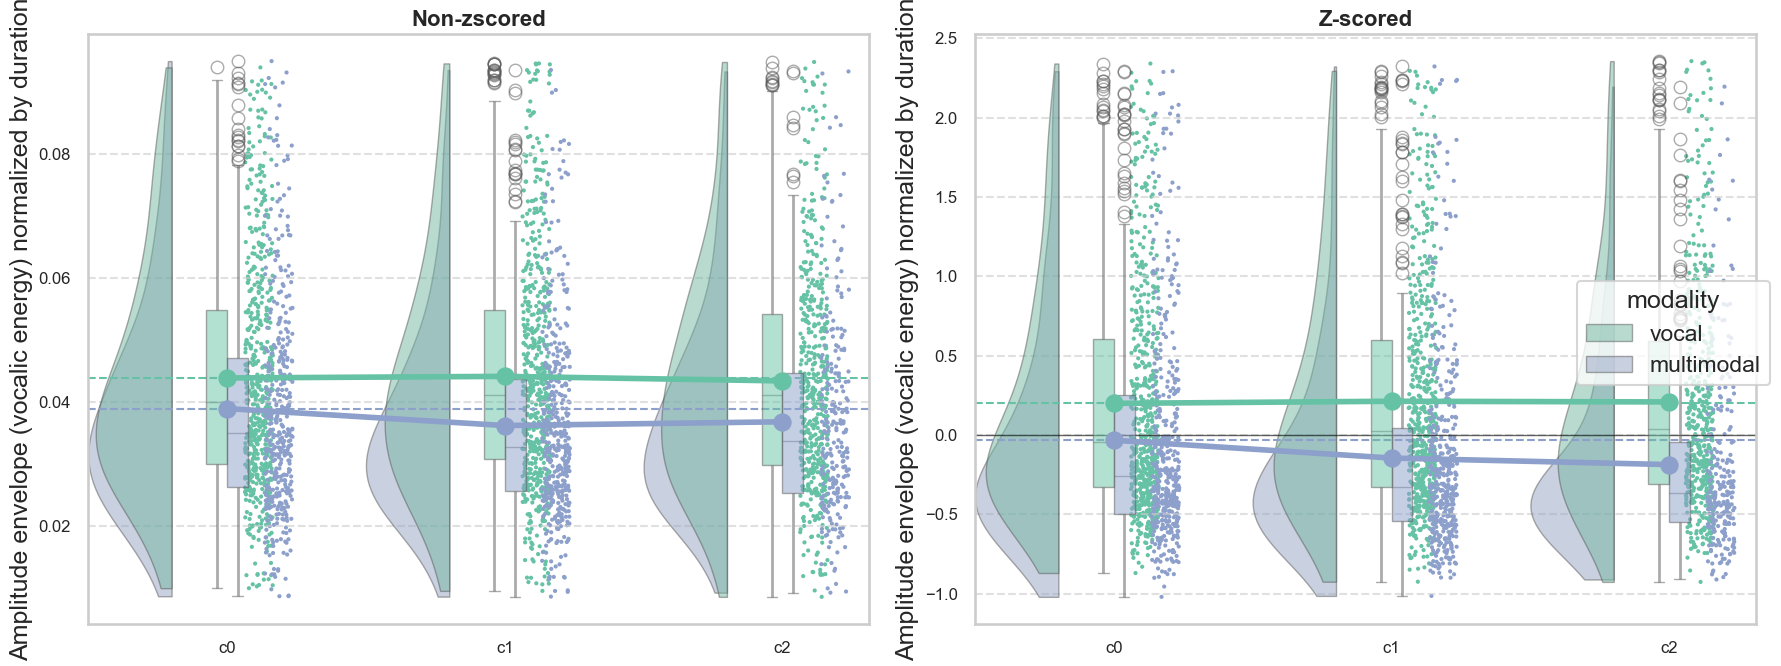
plot_raincloud_comparison(features_df_nonz, features_df_z, var='envelope_norm_integral_norm', var_to_display='Amplitude envelope (vocalic energy) normalized by duration', log_transform=False, modalityout='gesture', correctionout='c0_only')
Removed 6.57% of data as outliers based on Amplitude envelope (vocalic energy) normalized by duration.
Percentage of z-scored data removed:  5.839172505839173

Amplitude Gstd

features_df_nonz = pd.read_csv(os.path.join(datafolder, "features_df_nonzscored_final.csv"))
features_df_z = pd.read_csv(os.path.join(datafolder, "features_df_zscored_feat_final.csv"))

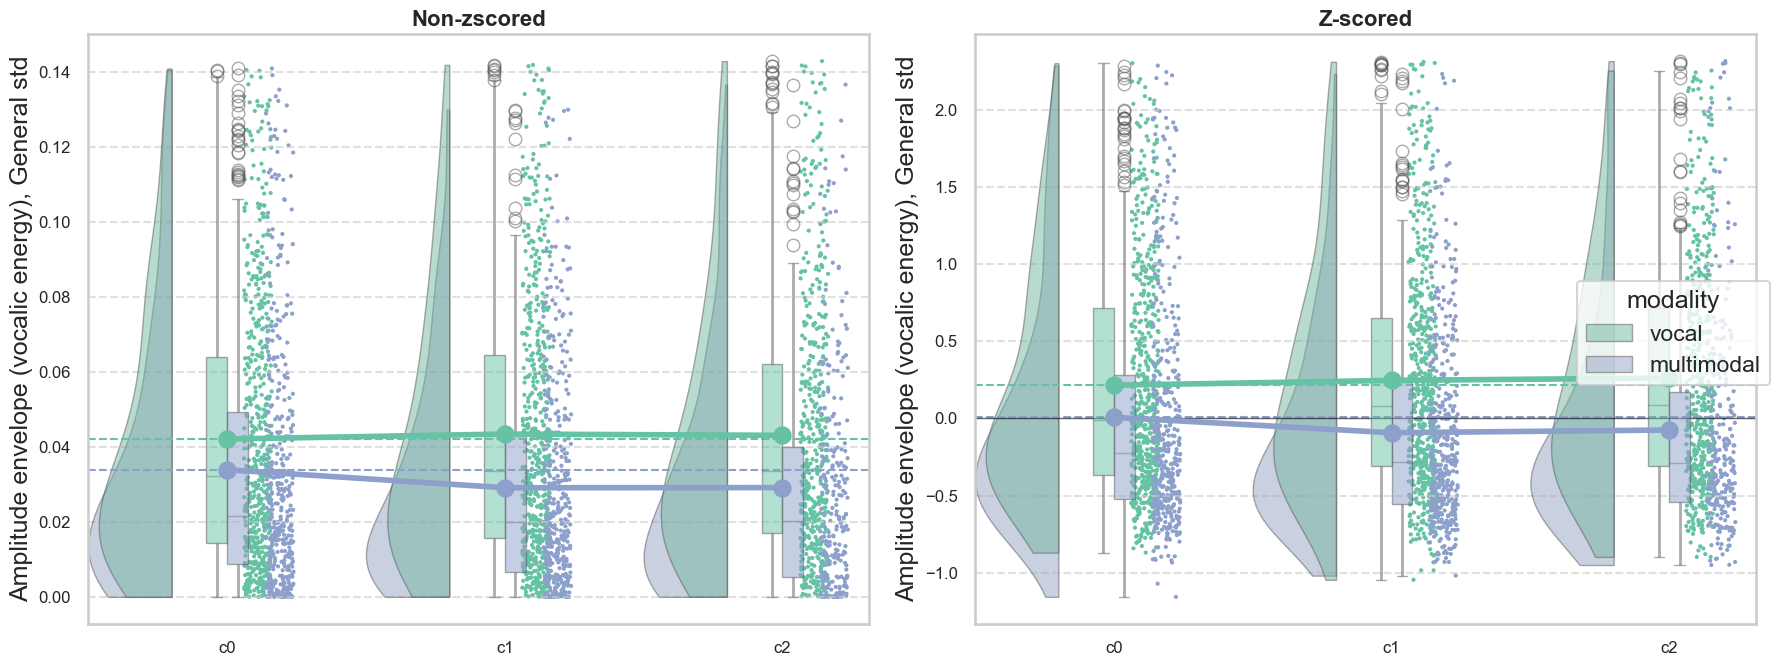
plot_raincloud_comparison(features_df_nonz, features_df_z, var='envelope_norm_Gstd', var_to_display='Amplitude envelope (vocalic energy), General std', log_transform=False, modalityout='gesture', correctionout='c0_only')
Removed 5.81% of data as outliers based on Amplitude envelope (vocalic energy), General std.
Percentage of z-scored data removed:  5.772439105772439

Amplitude envelope pospeak mean

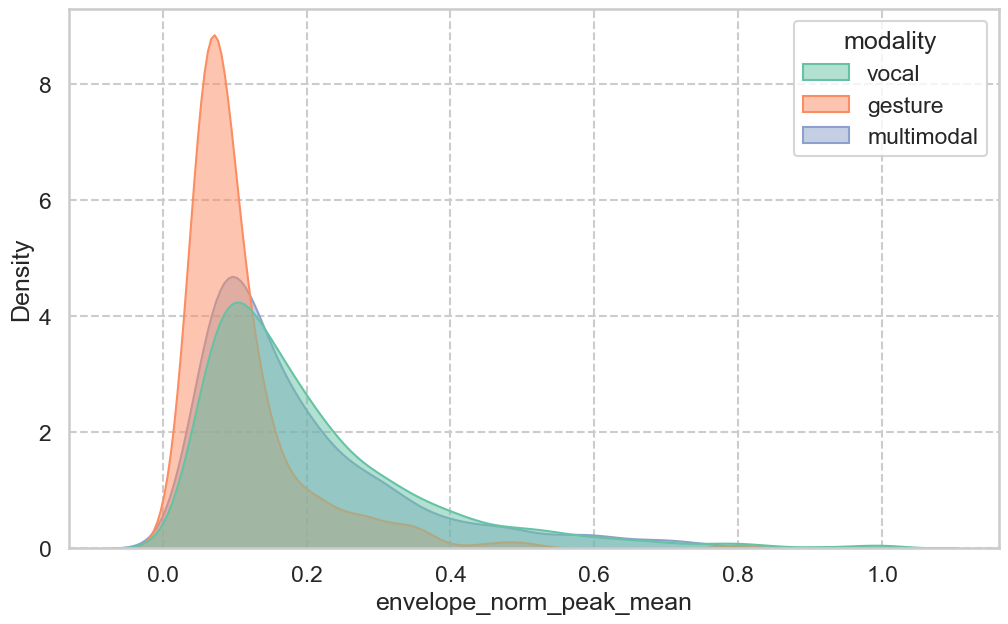
# density

features_df_nonz = pd.read_csv(os.path.join(datafolder, "features_df_nonzscored_final.csv"))

sns.set_context("talk")  # Larger font scale
sns.set_style("whitegrid", {'axes.grid': True, 'grid.linestyle': '--'})
plt.figure(figsize=(12, 7))
sns.kdeplot(
    data=features_df_nonz,
    x='envelope_norm_peak_mean',
    hue='modality',
    palette=modality_palette,
    fill=True,
    common_norm=False,
    alpha=0.5
)

All trials

features_df_nonz = pd.read_csv(os.path.join(datafolder, "features_df_nonzscored_final.csv"))
features_df_z = pd.read_csv(os.path.join(datafolder, "features_df_zscored_feat_final.csv"))

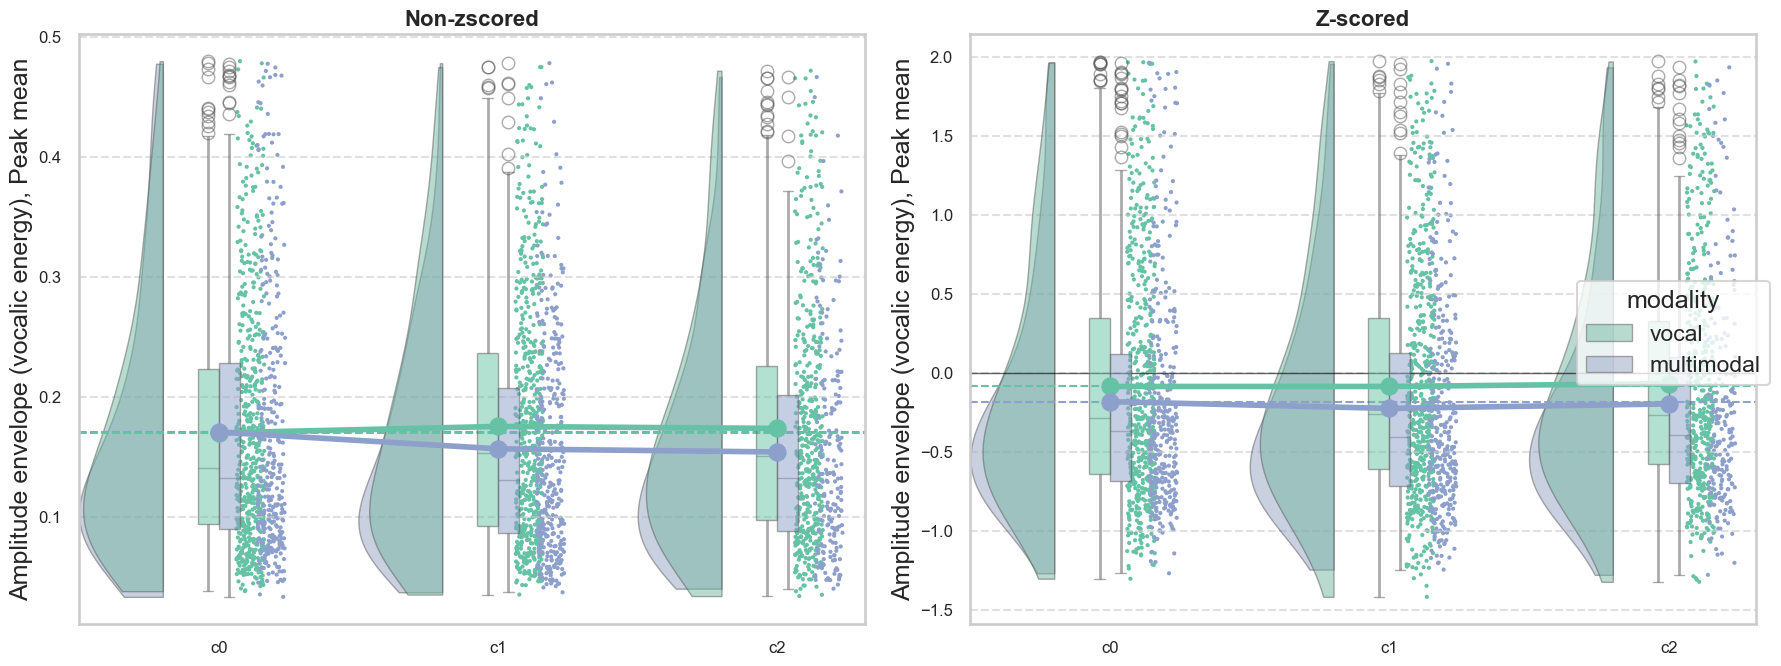
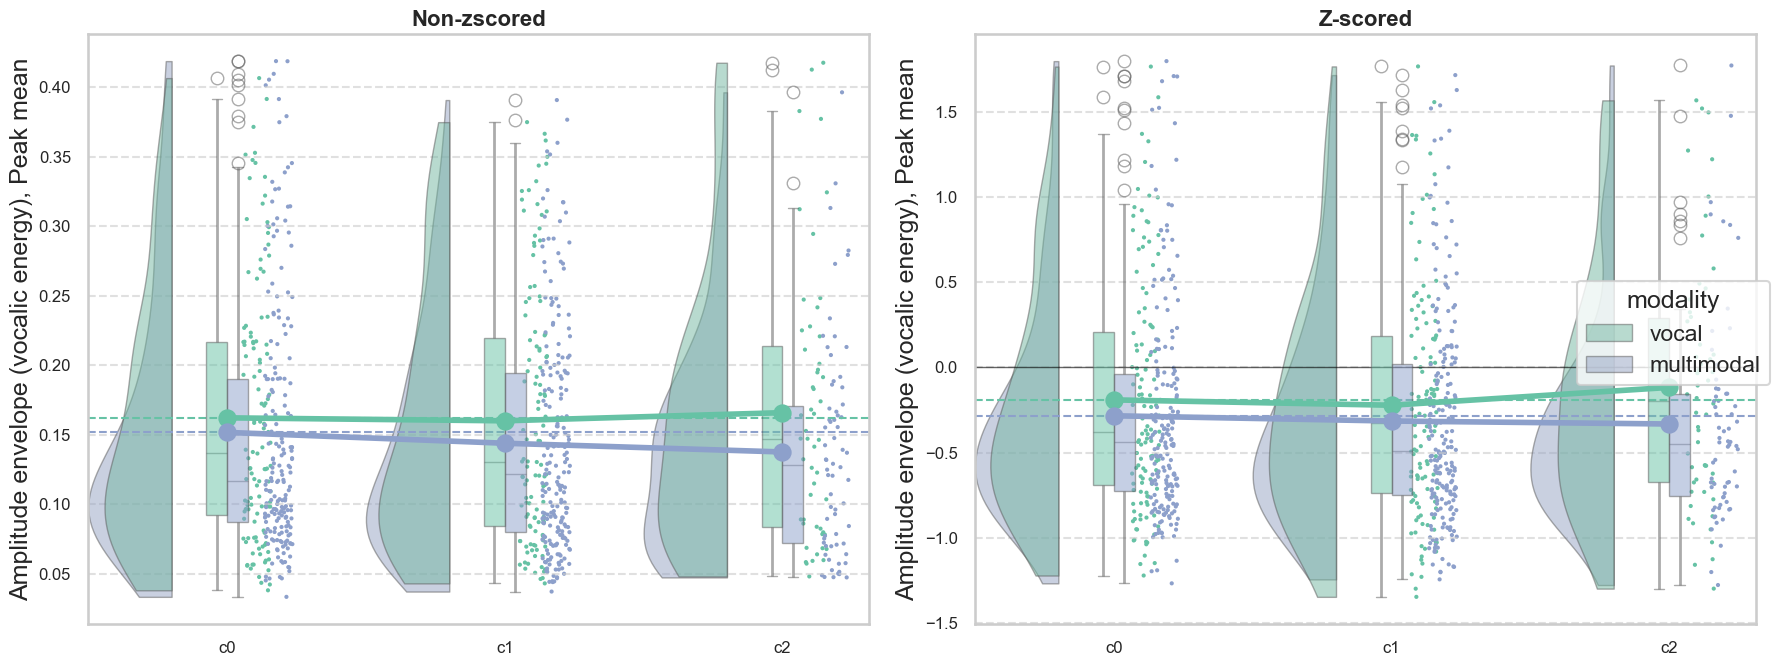
plot_raincloud_comparison(features_df_nonz, features_df_z, var='envelope_norm_peak_mean', var_to_display='Amplitude envelope (vocalic energy), Peak mean', log_transform=False, modalityout='gesture', correctionout='c0_only')
Removed 15.52% of data as outliers based on Amplitude envelope (vocalic energy), Peak mean.
Percentage of z-scored data removed:  14.914914914914915

Succesful trials

features_df_nonz = pd.read_csv(os.path.join(datafolder, "features_df_nonzscored_final.csv"))
features_df_z = pd.read_csv(os.path.join(datafolder, "features_df_zscored_feat_final.csv"))

# in concept_id, add the first element from TrialID before all the elements
features_df_nonz['concept_id'] = features_df_nonz['TrialID'].str.split('_').str[0] + '_' + features_df_nonz['concept_id']
    
for concept_id, group in features_df_nonz.groupby('concept_id'):
    overall_success = check_overall_success(group)
    features_df_nonz.loc[group.index, 'overall_success'] = overall_success

for concept_id, group in features_df_z.groupby('concept_id'):
    overall_success = check_overall_success(group)
    features_df_z.loc[group.index, 'overall_success'] = overall_success

# now plot raincloud plot only for overall_success == 1
plot_raincloud_comparison(features_df_nonz[features_df_nonz['overall_success'] == 1], features_df_z[features_df_z['overall_success'] == 1], var='envelope_norm_peak_mean', var_to_display='Amplitude envelope (vocalic energy), Peak mean', log_transform=False, modalityout='gesture', correctionout='c0_only')
Removed 20.42% of data as outliers based on Amplitude envelope (vocalic energy), Peak mean.
Percentage of z-scored data removed:  20.210526315789473

Amplitude envelope peak std

features_df_nonz = pd.read_csv(os.path.join(datafolder, "features_df_nonzscored_final.csv"))
features_df_z = pd.read_csv(os.path.join(datafolder, "features_df_zscored_feat_final.csv"))

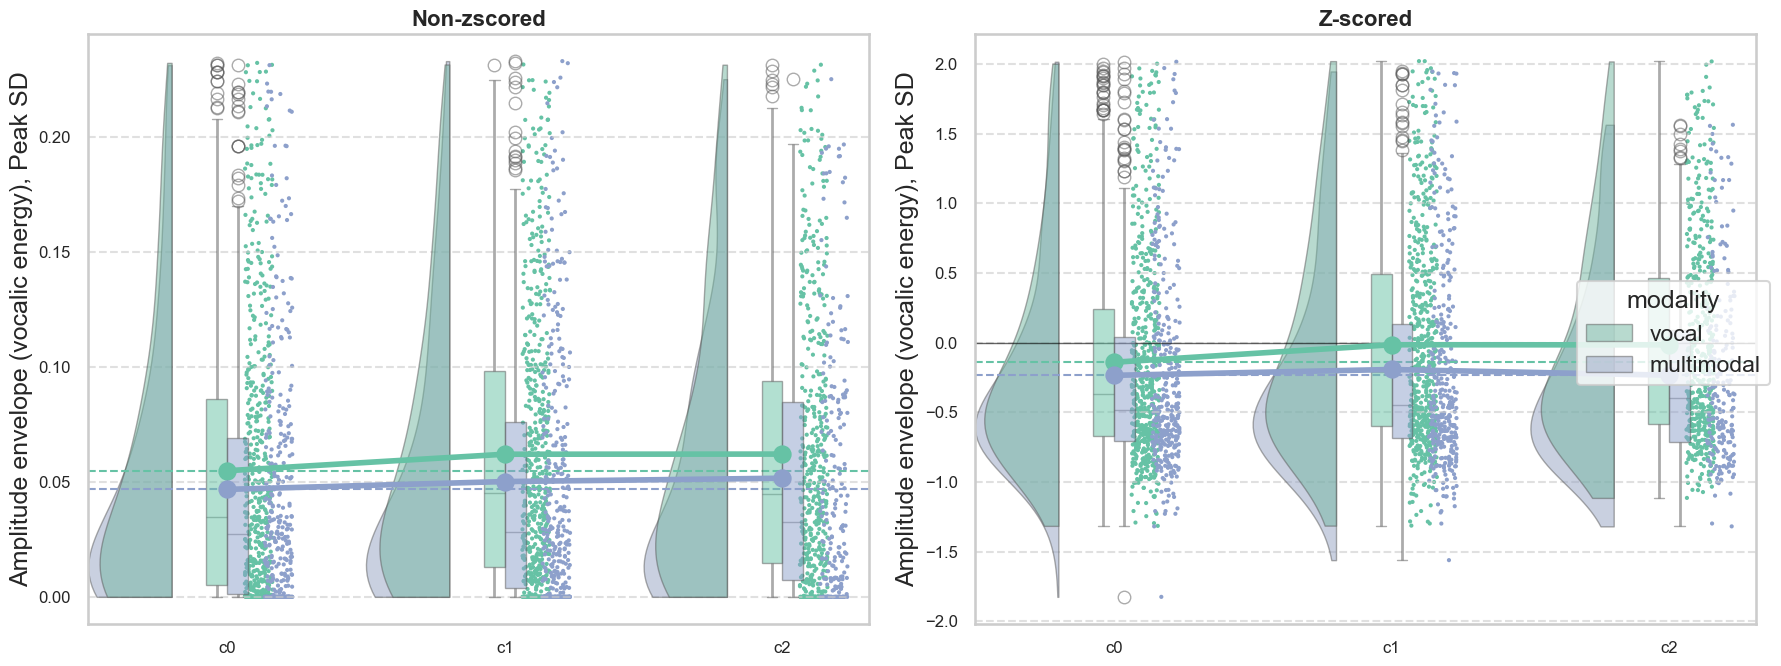
plot_raincloud_comparison(features_df_nonz, features_df_z, var='envelope_norm_peak_std', var_to_display='Amplitude envelope (vocalic energy), Peak SD', log_transform=False, modalityout='gesture', correctionout='c0_only')
Removed 14.31% of data as outliers based on Amplitude envelope (vocalic energy), Peak SD.
Percentage of z-scored data removed:  14.848181514848182

Amplitude number of peaks

features_df_nonz = pd.read_csv(os.path.join(datafolder, "features_df_nonzscored_final.csv"))
features_df_z = pd.read_csv(os.path.join(datafolder, "features_df_zscored_feat_final.csv"))

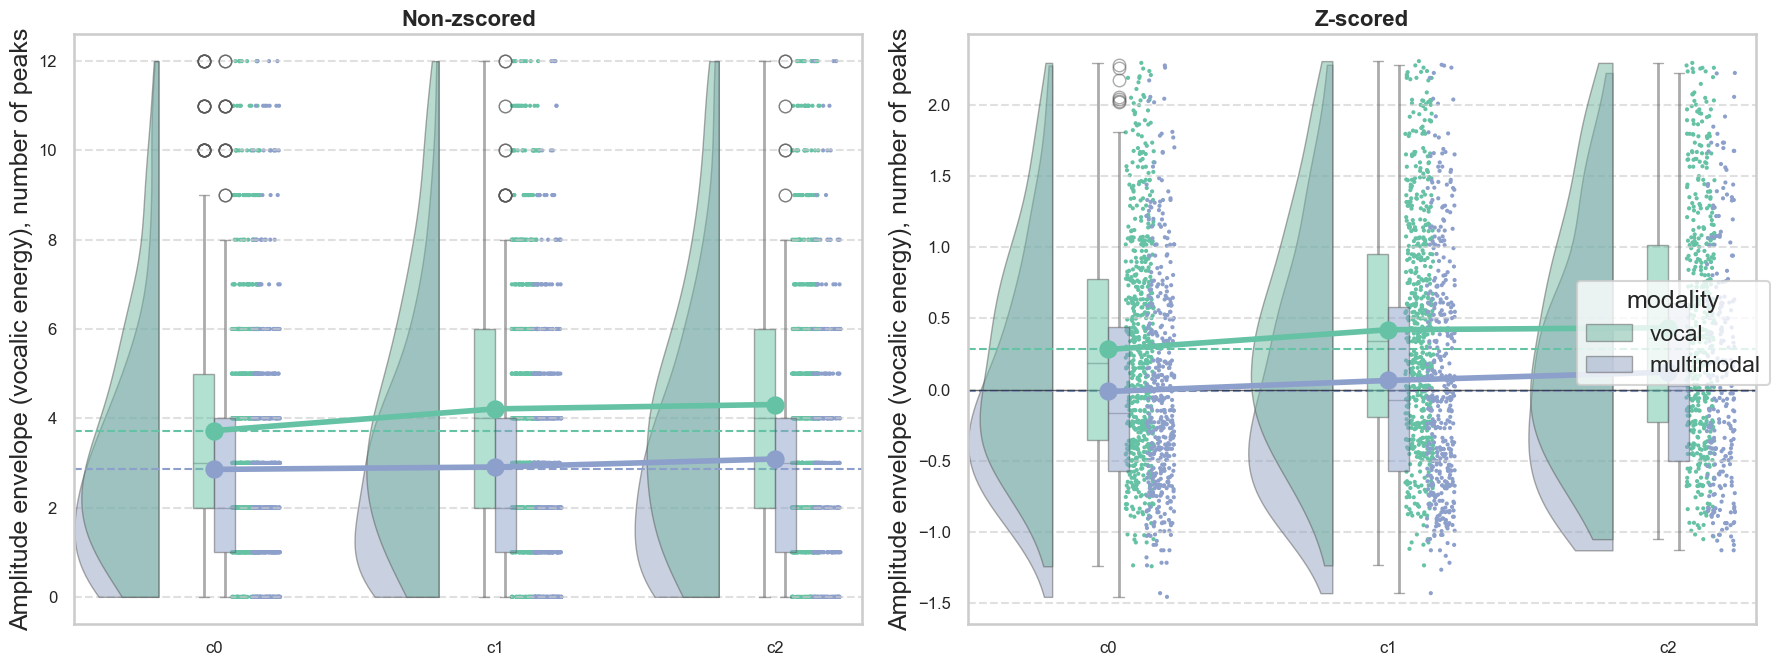
plot_raincloud_comparison(features_df_nonz, features_df_z, var='envelope_norm_peak_n', var_to_display='Amplitude envelope (vocalic energy), number of peaks', log_transform=False, modalityout='gesture', correctionout='c0_only')
Removed 5.14% of data as outliers based on Amplitude envelope (vocalic energy), number of peaks.
Percentage of z-scored data removed:  4.904904904904905

COPc integral

features_df_nonz = pd.read_csv(os.path.join(datafolder, "features_df_nonzscored_final.csv"))
features_df_nonz['COPc_integral'] = np.log(features_df_nonz['COPc_integral'] + 1)

sns.set_context("talk")  # Larger font scale
sns.set_style("whitegrid", {'axes.grid': True, 'grid.linestyle': '--'})
plt.figure(figsize=(12, 7))
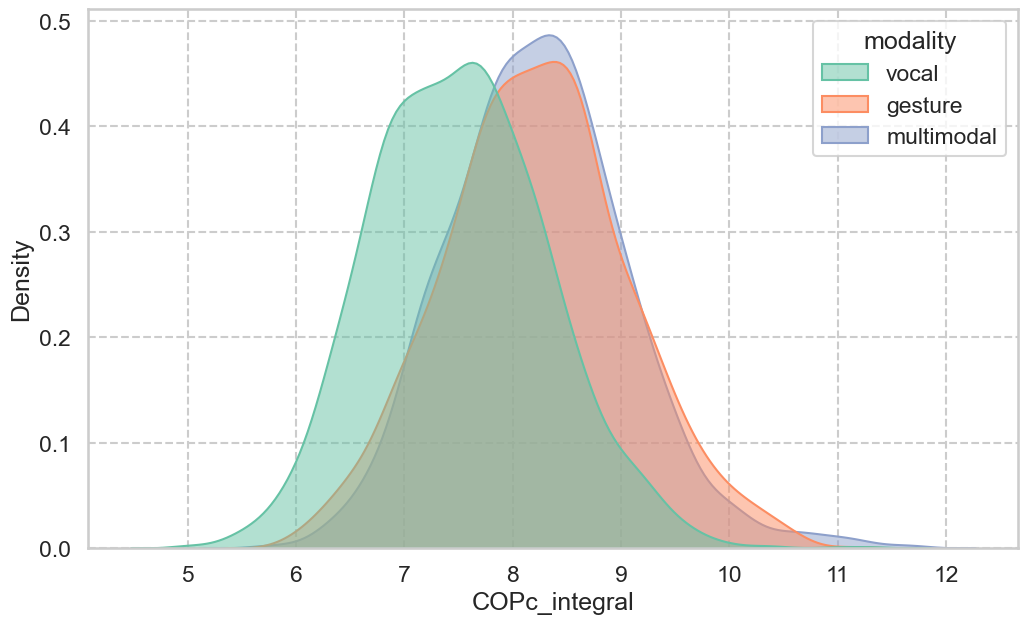
sns.kdeplot(
    data=features_df_nonz,
    x='COPc_integral',
    hue='modality',
    palette=modality_palette,
    fill=True,
    common_norm=False,
    alpha=0.5
)

All trials

features_df_nonz = pd.read_csv(os.path.join(datafolder, "features_df_nonzscored_final.csv"))
features_df_z = pd.read_csv(os.path.join(datafolder, "features_df_zscored_feat_final.csv"))

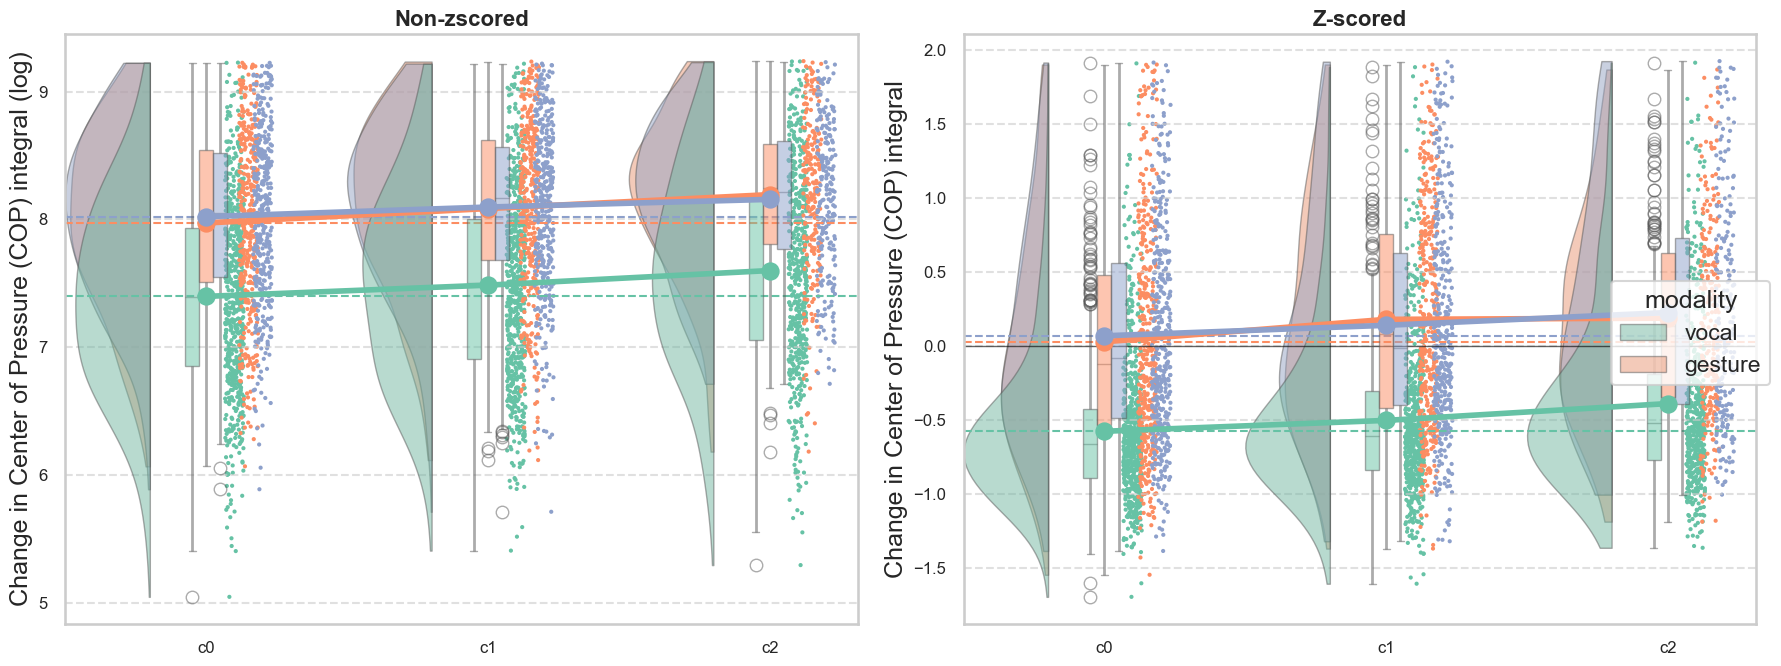
plot_raincloud_comparison(features_df_nonz, features_df_z, var='COPc_integral', var_to_display='Change in Center of Pressure (COP) integral', log_transform=True, modalityout='', correctionout='c0_only')
Removed 7.31% of data as outliers based on Change in Center of Pressure (COP) integral.
Percentage of z-scored data removed:  5.213613323678494

Succesful trials

features_df_nonz = pd.read_csv(os.path.join(datafolder, "features_df_nonzscored_final.csv"))
features_df_z = pd.read_csv(os.path.join(datafolder, "features_df_zscored_feat_final.csv"))
features_df_nonz['concept_id'] = features_df_nonz['TrialID'].str.split('_').str[0] + '_' + features_df_nonz['concept_id']

for concept_id, group in features_df_nonz.groupby('concept_id'):
    overall_success = check_overall_success(group)
    features_df_nonz.loc[group.index, 'overall_success'] = overall_success

for concept_id, group in features_df_z.groupby('concept_id'):
    overall_success = check_overall_success(group)
    features_df_z.loc[group.index, 'overall_success'] = overall_success

# now plot raincloud plot only for overall_success == 1 for COPc_integral
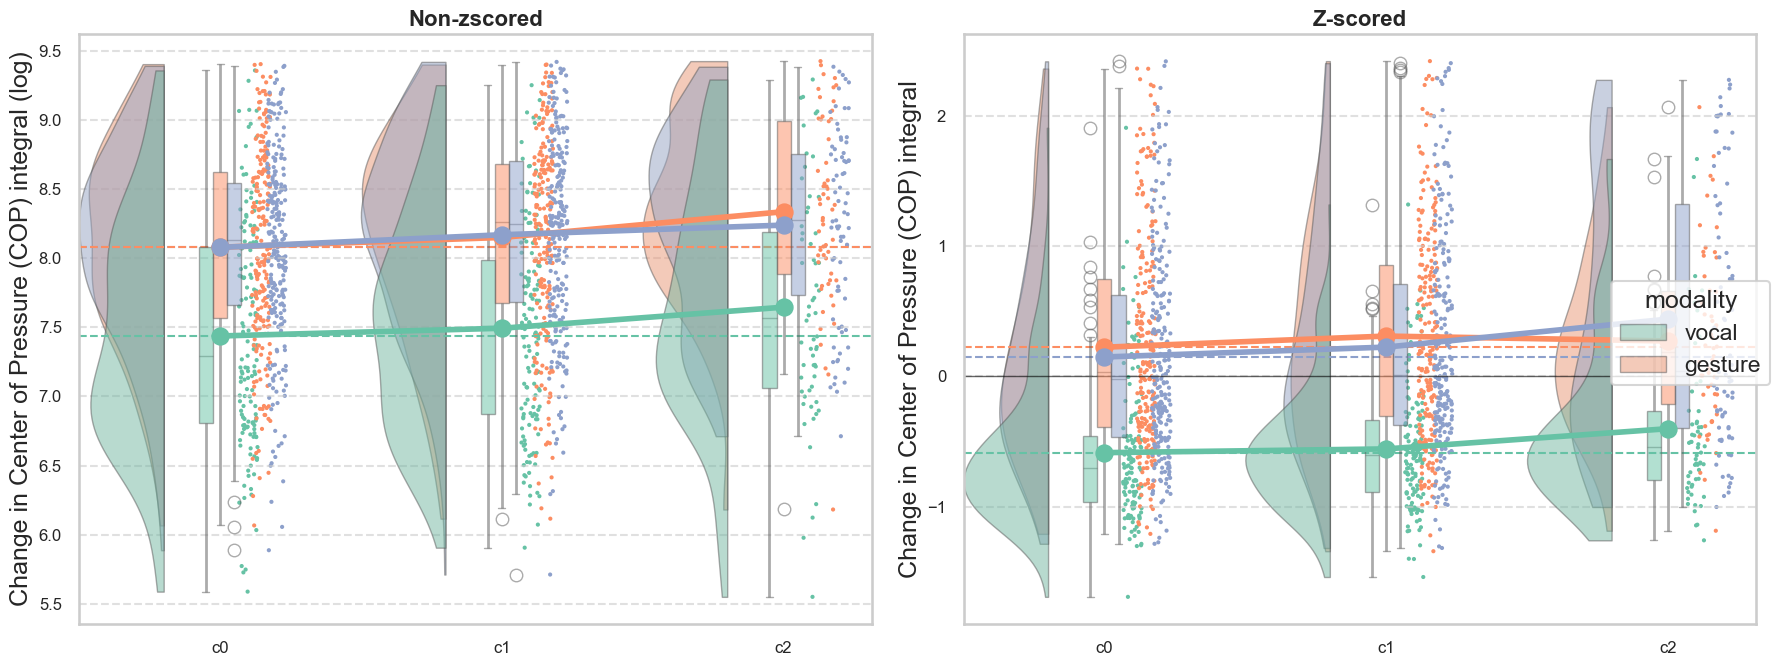
plot_raincloud_comparison(features_df_nonz[features_df_nonz['overall_success'] == 1], features_df_z[features_df_z['overall_success'] == 1], var='COPc_integral', var_to_display='Change in Center of Pressure (COP) integral', log_transform=True, modalityout='', correctionout='c0_only')
Removed 7.95% of data as outliers based on Change in Center of Pressure (COP) integral.
Percentage of z-scored data removed:  5.454545454545454

COPc integral (normalized by time)

features_df_nonz = pd.read_csv(os.path.join(datafolder, "features_df_nonzscored_final.csv"))
features_df_z = pd.read_csv(os.path.join(datafolder, "features_df_zscored_feat_final.csv"))

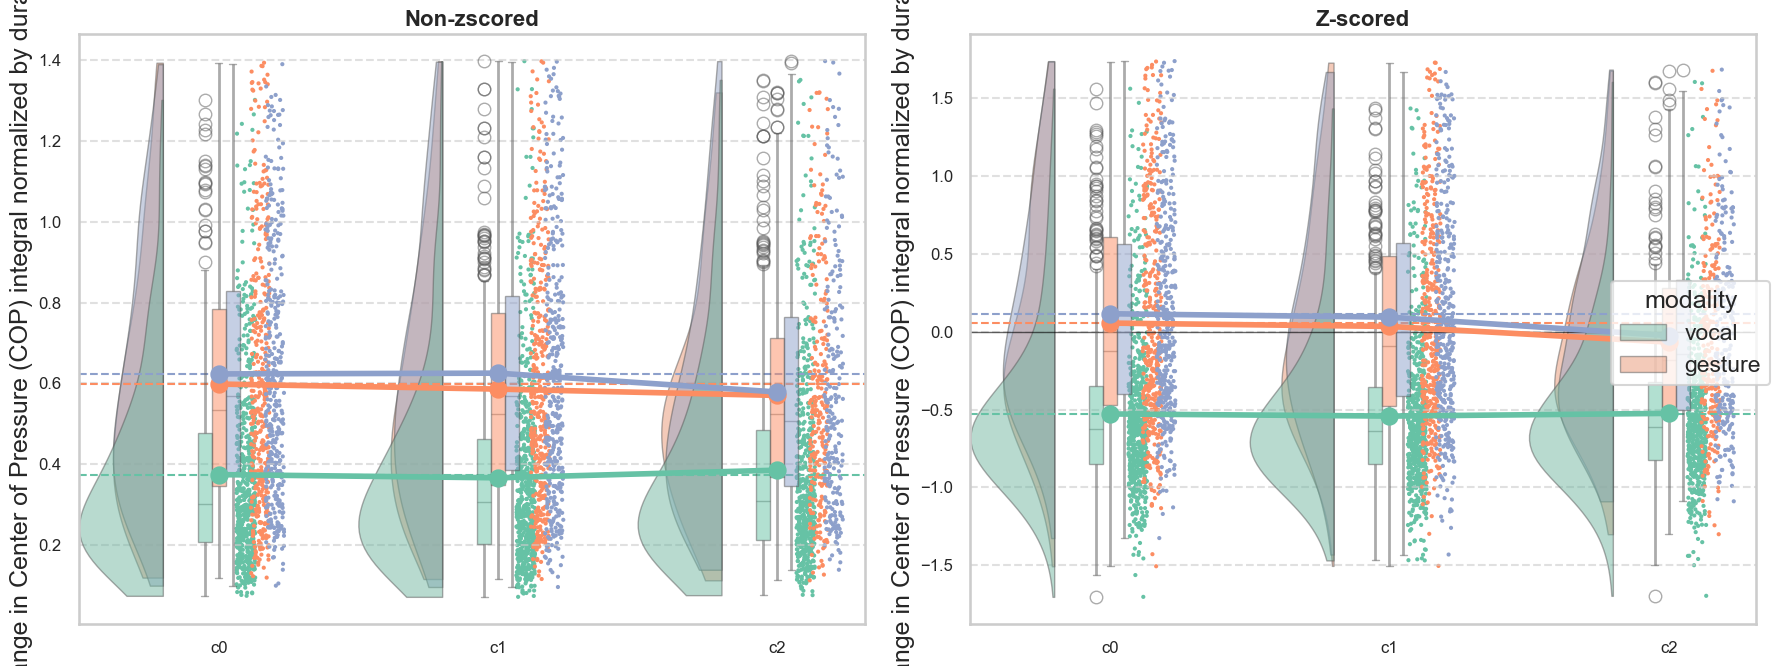
plot_raincloud_comparison(features_df_nonz, features_df_z, var='COPc_integral_norm', var_to_display='Change in Center of Pressure (COP) integral normalized by duration', log_transform=False, modalityout='', correctionout='c0_only')
Removed 5.58% of data as outliers based on Change in Center of Pressure (COP) integral normalized by duration.
Percentage of z-scored data removed:  5.1653391262370265

COPc Gstd

features_df_nonz = pd.read_csv(os.path.join(datafolder, "features_df_nonzscored_final.csv"))
features_df_z = pd.read_csv(os.path.join(datafolder, "features_df_zscored_feat_final.csv"))

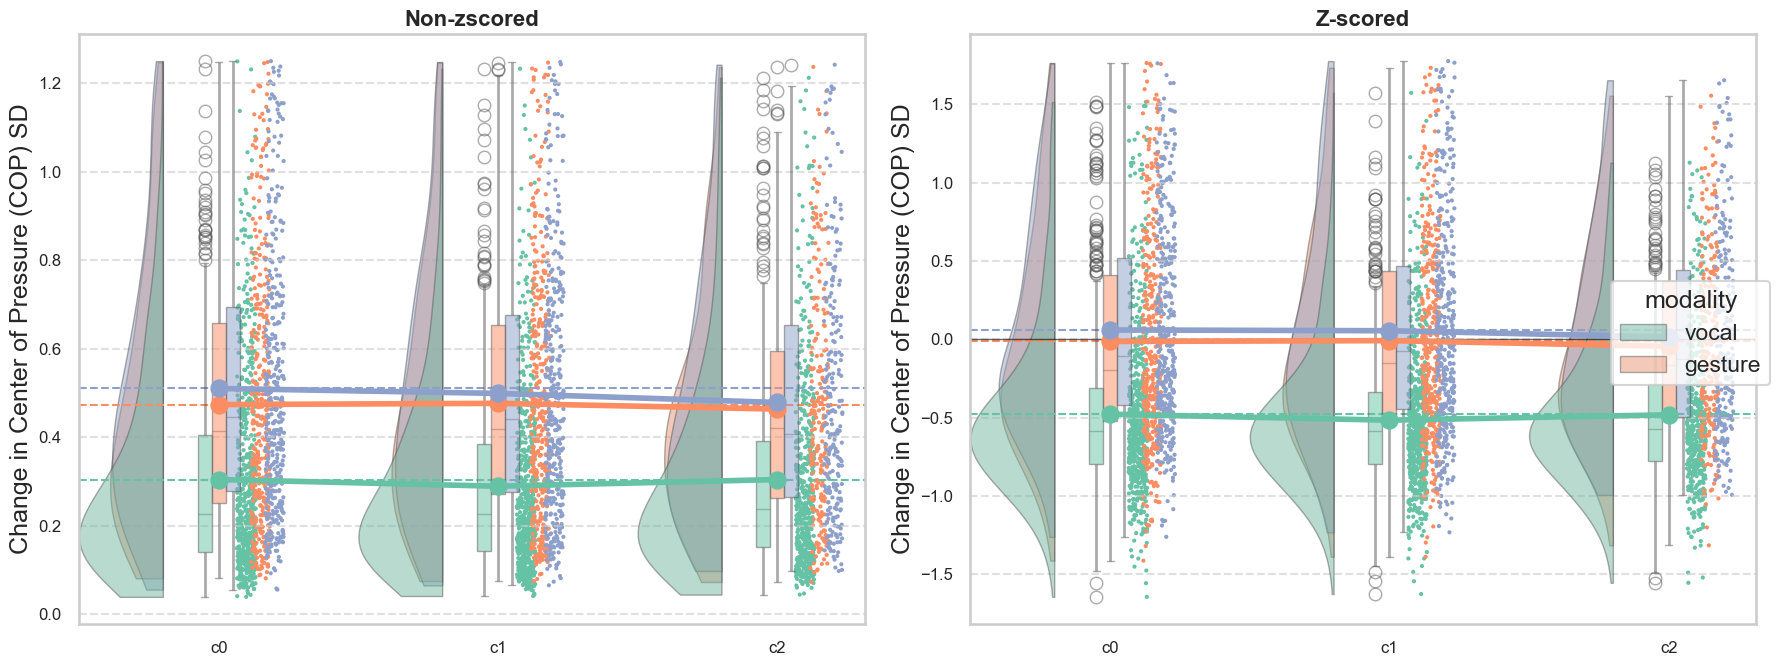
plot_raincloud_comparison(features_df_nonz, features_df_z, var='COPc_Gstd', var_to_display='Change in Center of Pressure (COP) SD', log_transform=False, modalityout='', correctionout='c0_only')
Removed 6.90% of data as outliers based on Change in Center of Pressure (COP) SD.
Percentage of z-scored data removed:  5.623944001930968

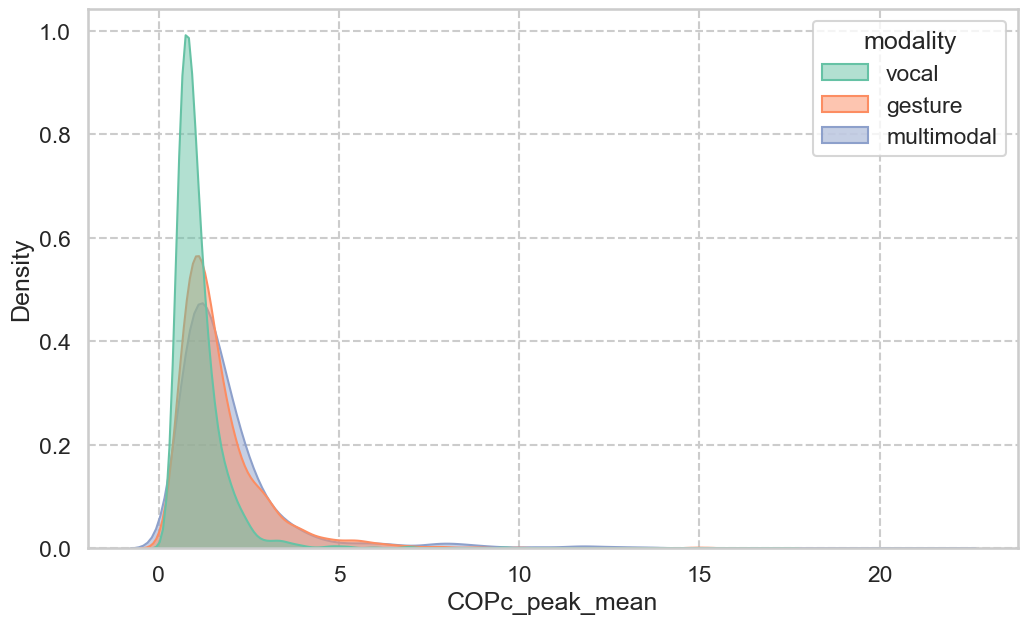
COPc pospeak mean

features_df_nonz = pd.read_csv(os.path.join(datafolder, "features_df_nonzscored_final.csv"))

sns.set_context("talk")  # Larger font scale
sns.set_style("whitegrid", {'axes.grid': True, 'grid.linestyle': '--'})
plt.figure(figsize=(12, 7))
sns.kdeplot(
    data=features_df_nonz,
    x='COPc_peak_mean',
    hue='modality',
    palette=modality_palette,
    fill=True,
    common_norm=False,
    alpha=0.5
)

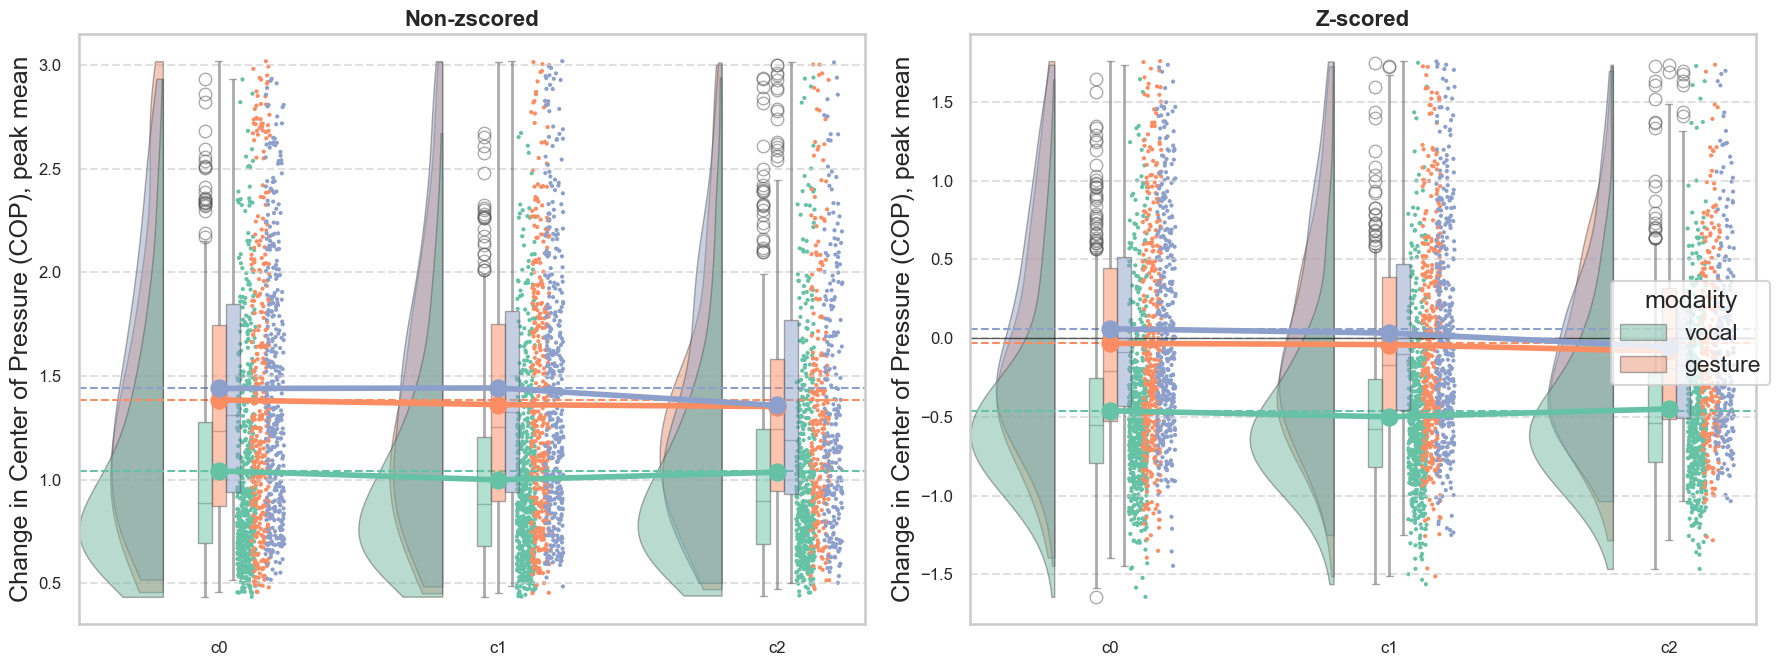
All trials

features_df_nonz = pd.read_csv(os.path.join(datafolder, "features_df_nonzscored_final.csv"))
features_df_z = pd.read_csv(os.path.join(datafolder, "features_df_zscored_feat_final.csv"))

plot_raincloud_comparison(features_df_nonz, features_df_z, 
                          var='COPc_peak_mean', 
                          var_to_display='Change in Center of Pressure (COP), peak mean', 
                          log_transform=False, 
                          modalityout='', 
                          correctionout='c0_only')
Removed 8.59% of data as outliers based on Change in Center of Pressure (COP), peak mean.
Percentage of z-scored data removed:  7.723871590634805

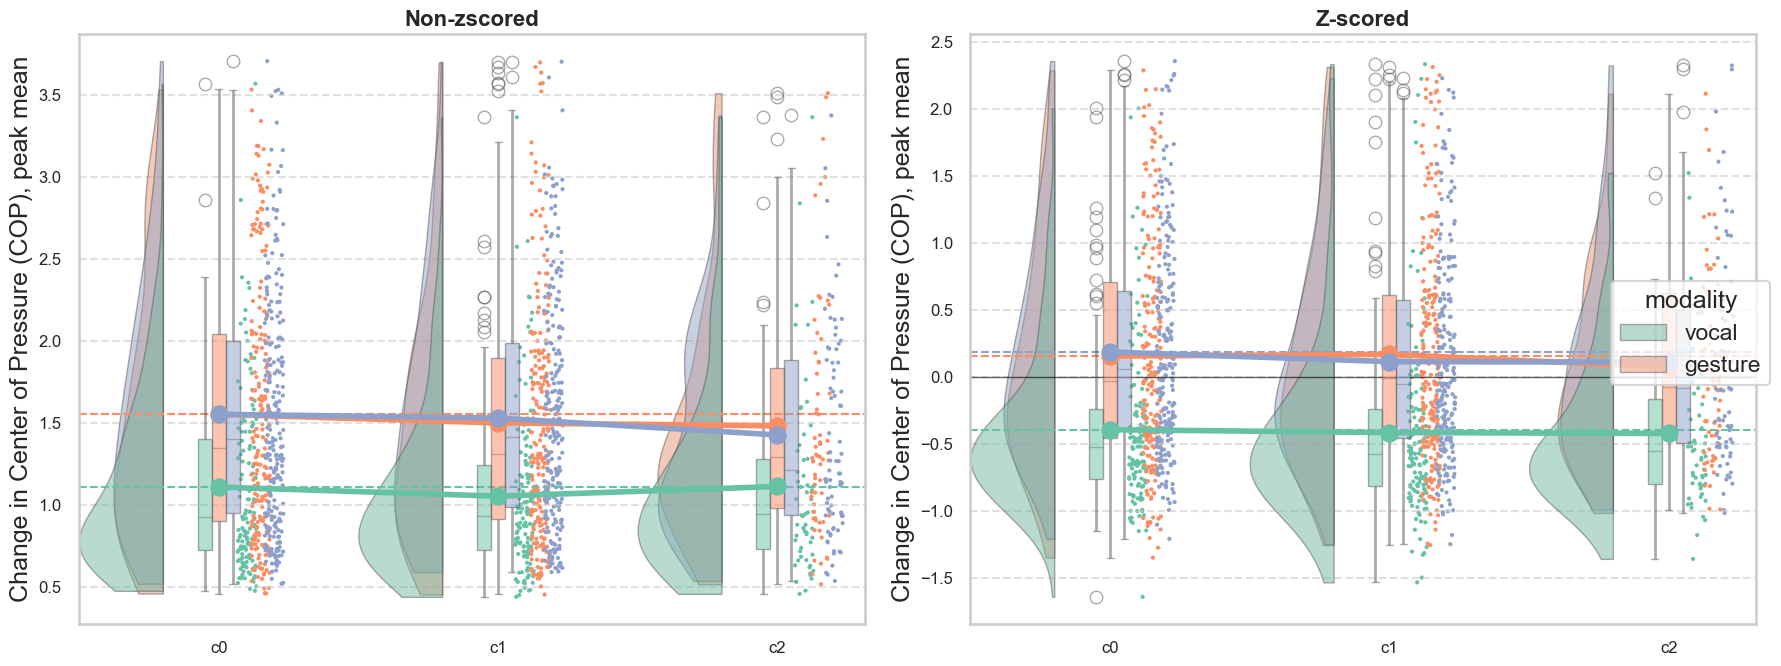
Successful trials

features_df_nonz = pd.read_csv(os.path.join(datafolder, "features_df_nonzscored_final.csv"))
features_df_z = pd.read_csv(os.path.join(datafolder, "features_df_zscored_feat_final.csv"))
features_df_nonz['concept_id'] = features_df_nonz['TrialID'].str.split('_').str[0] + '_' + features_df_nonz['concept_id']
    
for concept_id, group in features_df_nonz.groupby('concept_id'):
    overall_success = check_overall_success(group)
    features_df_nonz.loc[group.index, 'overall_success'] = overall_success

for concept_id, group in features_df_z.groupby('concept_id'):
    overall_success = check_overall_success(group)
    features_df_z.loc[group.index, 'overall_success'] = overall_success

plot_raincloud_comparison(features_df_nonz[features_df_nonz['overall_success'] == 1], features_df_z[features_df_z['overall_success'] == 1], var='COPc_peak_mean', var_to_display='Change in Center of Pressure (COP), peak mean', log_transform=False, modalityout='', correctionout='c0_only')
Removed 8.35% of data as outliers based on Change in Center of Pressure (COP), peak mean.
Percentage of z-scored data removed:  6.801346801346801

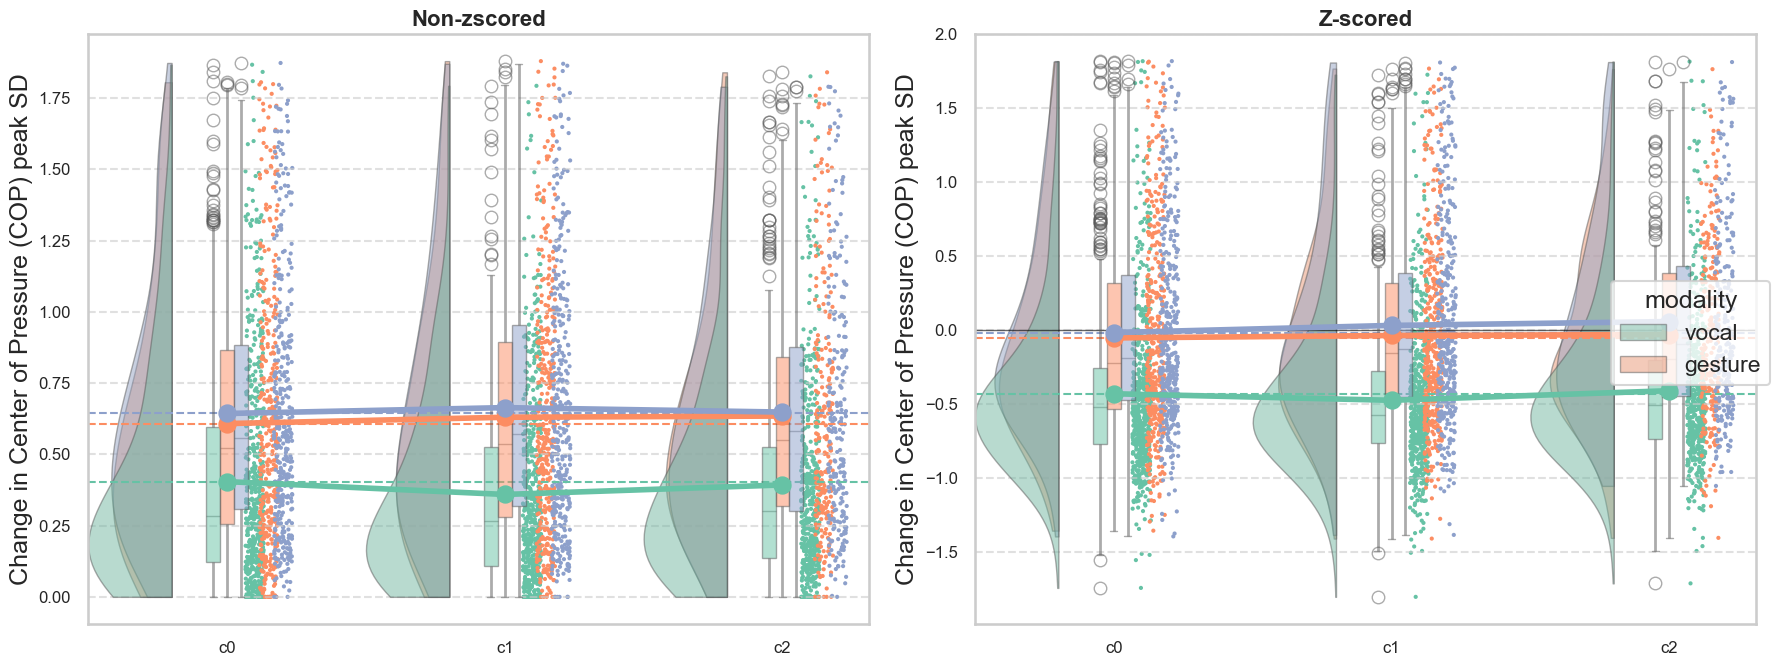
COP peak SD

features_df_nonz = pd.read_csv(os.path.join(datafolder, "features_df_nonzscored_final.csv"))
features_df_z = pd.read_csv(os.path.join(datafolder, "features_df_zscored_feat_final.csv"))

plot_raincloud_comparison(features_df_nonz, features_df_z, var='COPc_peak_std', var_to_display='Change in Center of Pressure (COP) peak SD', log_transform=False, modalityout='', correctionout='c0_only')
Removed 10.52% of data as outliers based on Change in Center of Pressure (COP) peak SD.
Percentage of z-scored data removed:  7.916968380400675

COPc number of peaks

features_df_nonz = pd.read_csv(os.path.join(datafolder, "features_df_nonzscored_final.csv"))
features_df_z = pd.read_csv(os.path.join(datafolder, "features_df_zscored_feat_final.csv"))

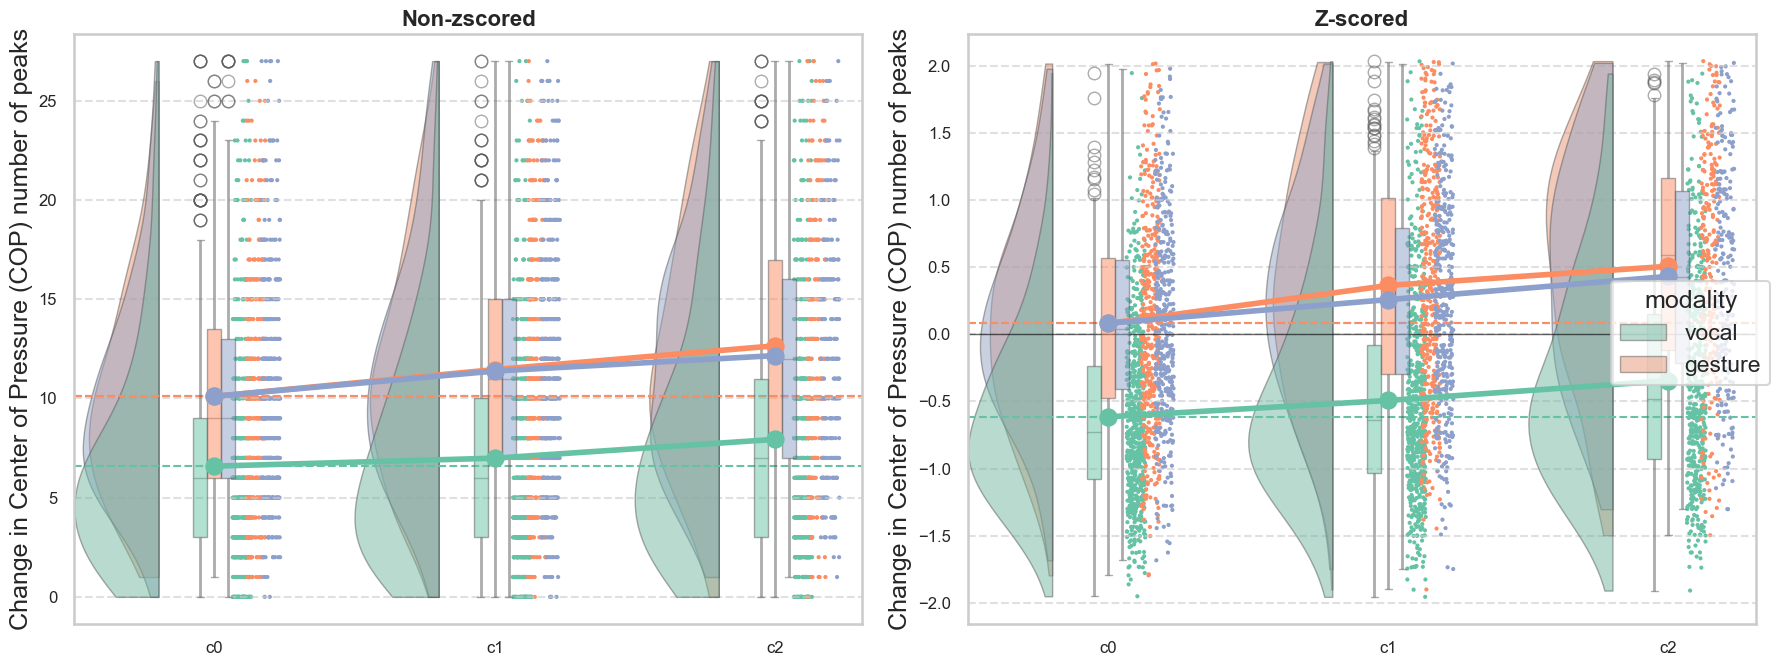
plot_raincloud_comparison(features_df_nonz, features_df_z, var='COPc_peak_n', var_to_display='Change in Center of Pressure (COP) number of peaks', log_transform=False, modalityout='', correctionout='c0_only')
Removed 3.64% of data as outliers based on Change in Center of Pressure (COP) number of peaks.
Percentage of z-scored data removed:  4.417089065894279

Motor complexity, arms

features_df_nonz = pd.read_csv(os.path.join(datafolder, "features_df_nonzscored_final.csv"))
features_df_z = pd.read_csv(os.path.join(datafolder, "features_df_zscored_feat_final.csv"))

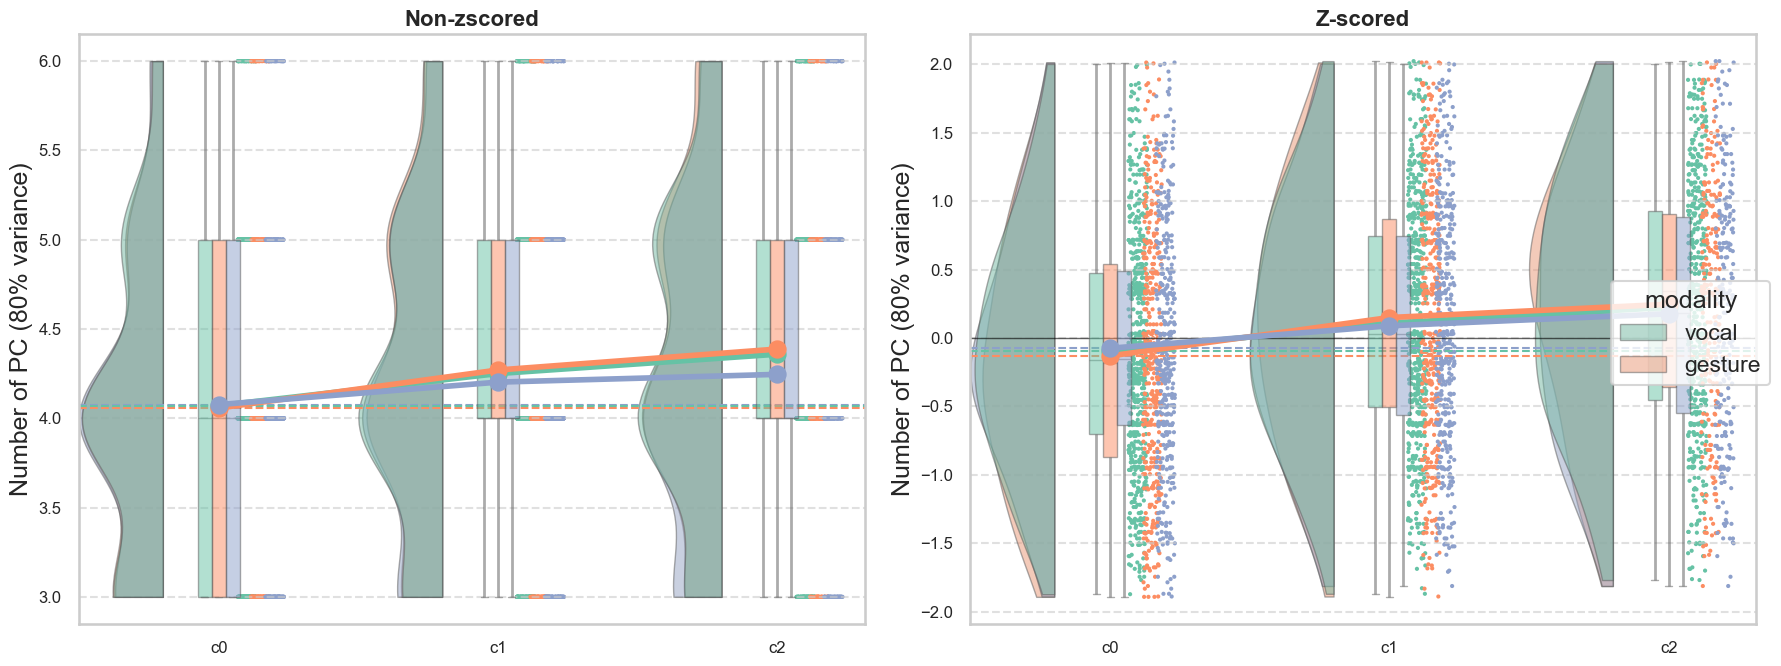
plot_raincloud_comparison(features_df_nonz, features_df_z, var='arm_nComp_80', var_to_display='Number of PC (80% variance)', log_transform=False, modalityout='', correctionout='c0_only')
Removed 0.82% of data as outliers based on Number of PC (80% variance).
Percentage of z-scored data removed:  4.392951967173546

features_df_nonz = pd.read_csv(os.path.join(datafolder, "features_df_nonzscored_final.csv"))
features_df_z = pd.read_csv(os.path.join(datafolder, "features_df_zscored_feat_final.csv"))

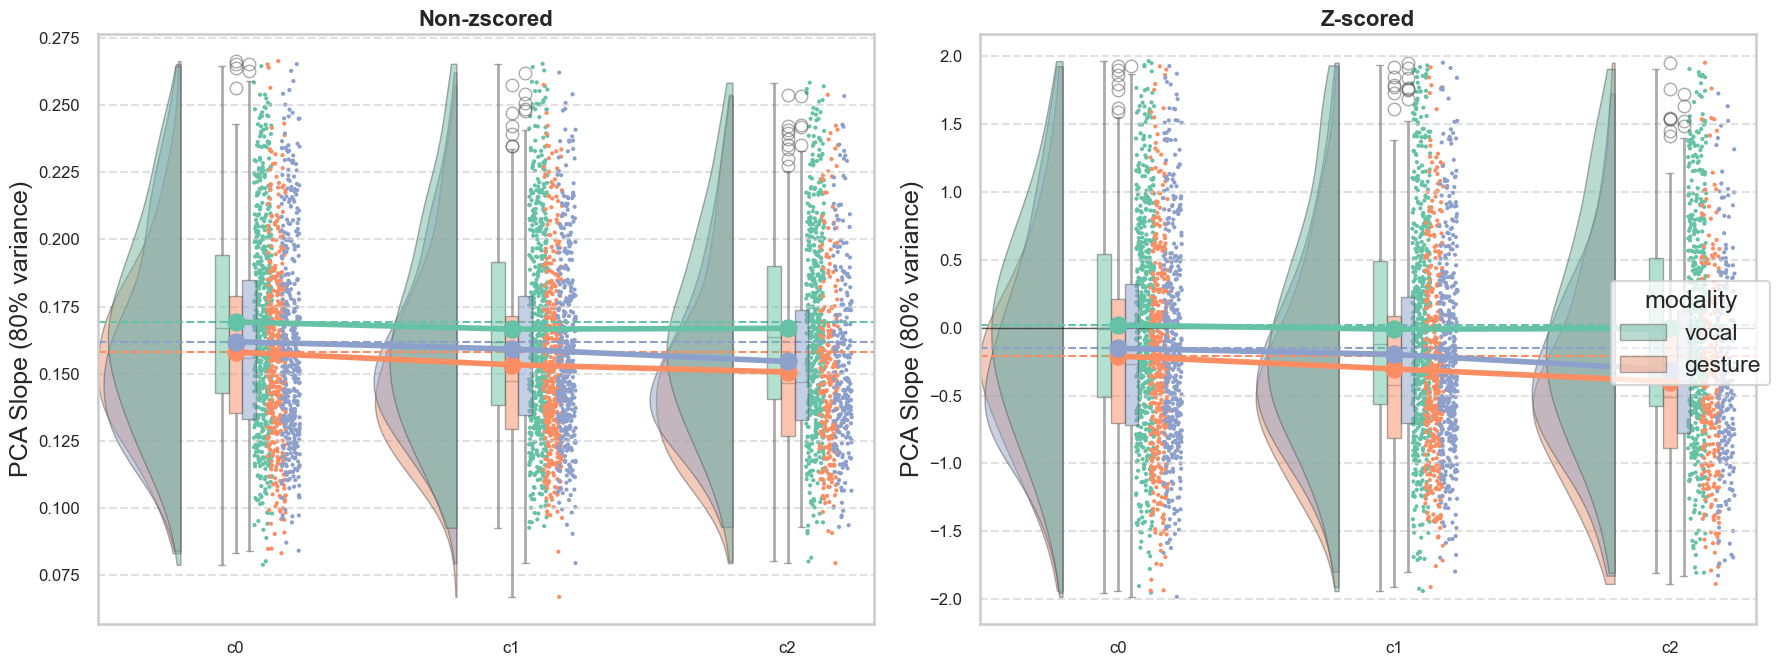
plot_raincloud_comparison(features_df_nonz, features_df_z, var='arm_slope_80', var_to_display='PCA Slope (80% variance)', log_transform=False, modalityout='', correctionout='c0_only')
Removed 3.48% of data as outliers based on PCA Slope (80% variance).
Percentage of z-scored data removed:  4.417089065894279

Motor complexity, body

features_df_nonz = pd.read_csv(os.path.join(datafolder, "features_df_nonzscored_final.csv"))
features_df_z = pd.read_csv(os.path.join(datafolder, "features_df_zscored_feat_final.csv"))

plot_raincloud_comparison(features_df_nonz, features_df_z, var='body_nComp_80', var_to_display='Number of PC (80% variance)', log_transform=False, modalityout='', correctionout='c0_only')
Removed 3.74% of data as outliers based on Number of PC (80% variance).
Percentage of z-scored data removed:  4.1998551774076756

features_df_nonz = pd.read_csv(os.path.join(datafolder, "features_df_nonzscored_final.csv"))
features_df_z = pd.read_csv(os.path.join(datafolder, "features_df_zscored_feat_final.csv"))

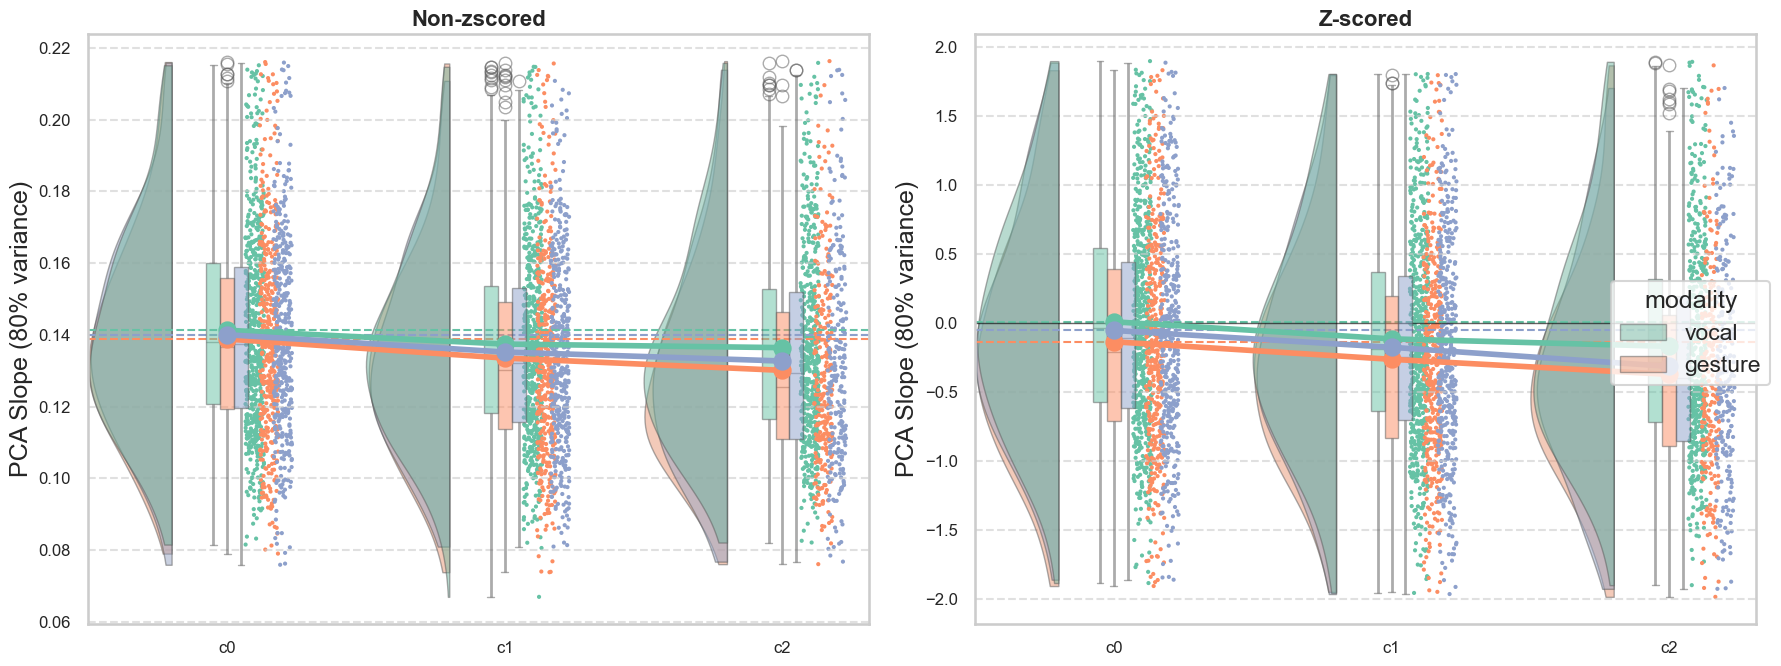
plot_raincloud_comparison(features_df_nonz, features_df_z, var='body_slope_80', var_to_display='PCA Slope (80% variance)', log_transform=False, modalityout='', correctionout='c0_only')
Removed 2.68% of data as outliers based on PCA Slope (80% variance).
Percentage of z-scored data removed:  4.80328264542602

Bin participants by effortfullness

data = pd.read_csv(os.path.join(datafolder, "features_df_nonzscored_final.csv"))

# create pcn_ID which is the first and last element of TrialID separated by _
data['pcn_ID'] = data['TrialID'].str.split('_').str[0] + '_' + data['TrialID'].str.split('_').str[-1]

# define columns of interest
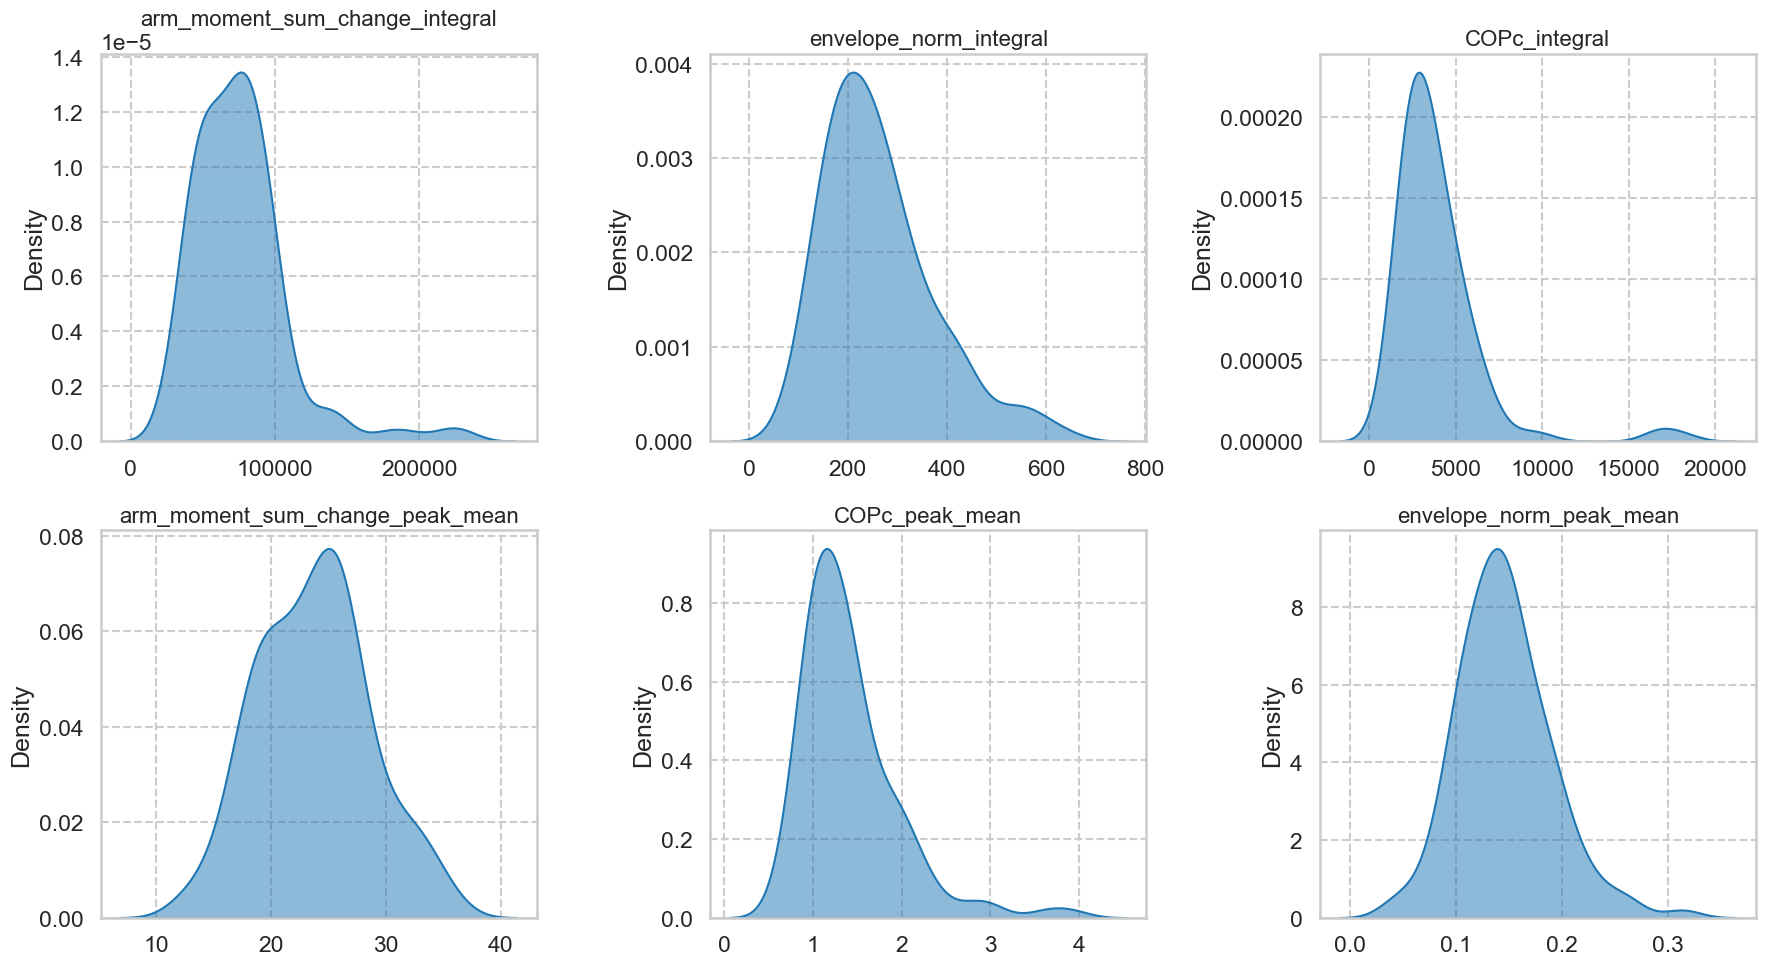
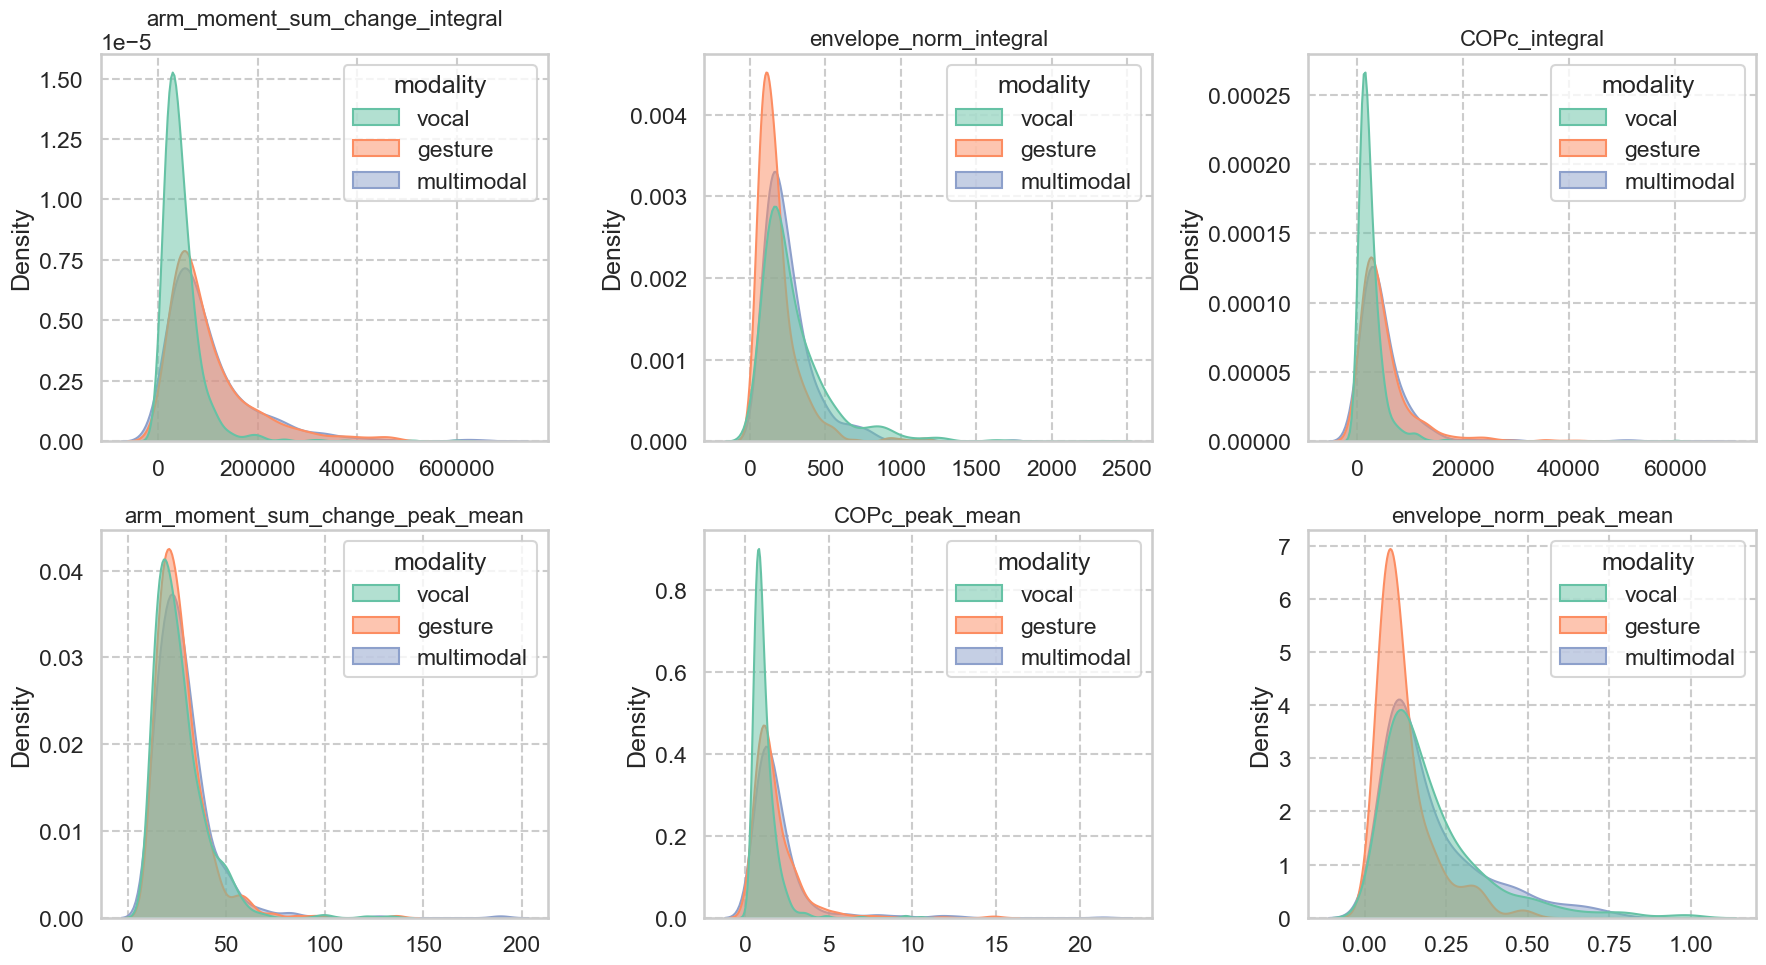
coi = ['pcn_ID', 'arm_moment_sum_change_integral', 'envelope_norm_integral', 'COPc_integral', 'arm_moment_sum_change_peak_mean', 'COPc_peak_mean', 'envelope_norm_peak_mean']
data_coi = data[coi]

# per participant, calculate the mean of each feature
participant_means = data_coi.groupby('pcn_ID').mean().reset_index()

features_to_plot = ['arm_moment_sum_change_integral', 'envelope_norm_integral', 'COPc_integral', 'arm_moment_sum_change_peak_mean', 'COPc_peak_mean', 'envelope_norm_peak_mean']
num_features = len(features_to_plot)
num_cols = 3
num_rows = (num_features + num_cols - 1) // num_cols
sns.set_context("talk")  # Larger font scale
sns.set_style("whitegrid", {'axes.grid': True, 'grid.linestyle': '--'})
plt.figure(figsize=(18, num_rows * 5))
for i, feature in enumerate(features_to_plot):
    plt.subplot(num_rows, num_cols, i + 1)
    sns.kdeplot(
        data=participant_means,
        x=feature,
        fill=True,
        common_norm=False,
        alpha=0.5
    )
    plt.title(feature, fontsize=16)
    plt.xlabel('')
    plt.ylabel('Density')
plt.tight_layout()
plt.show()
# create overall_effort_score which is the sum of the three tertiles (arm, COP, envelope) where 1st tertile = 1, 2nd tertile = 2, 3rd tertile = 3
def tertile_to_score(tertile):
    """Convert tertile label to numerical score.
    Args:
        tertile (str): Tertile label ('1st', '2nd', or '3rd')
    Returns:
        int: Numerical score (1, 2, or 3) or np.nan if invalid
    """
    if tertile == '1st':
        return 1
    elif tertile == '2nd':
        return 2
    elif tertile == '3rd':
        return 3
    else:
        return np.nan
    
# if the overall_effort_score is 3, then the participant is low effort, if it is 4-6, it is medium effort, if it is 7-9, it is high effort
def effort_category(score):
    """Convert numerical effort score to categorical effort level.
    Args:
        score (int): Numerical effort score (3-9)
    Returns:
        str: Categorical effort level ('Low Effort', 'Medium Effort', 'High Effort') or np.nan if invalid
    """
    if score == 3:
        return 'Low Effort'
    elif score >= 4 and score <= 6:
        return 'Medium Effort'
    elif score >= 7 and score <= 9:
        return 'High Effort'
    else:
        return np.nan

# for each feature, determine whether the participant is in the 1, 2 or 3rd tertile of the distribution of that feature, and create a new column for each feature with that information
for feature in features_to_plot:
    tertiles = participant_means[feature].quantile([0.33, 0.66])
    participant_means[feature + '_tertile'] = pd.cut(participant_means[feature], bins=[-np.inf, tertiles[0.33], tertiles[0.66], np.inf], labels=['1st', '2nd', '3rd'])

# make a mean tertile per pairs of features (eg arm integral+peak, COP integral+peak, envelope integral+peak)
participant_means['arm_tertile'] = participant_means[['arm_moment_sum_change_integral_tertile', 'arm_moment_sum_change_peak_mean_tertile']].mode(axis=1)[0]
participant_means['COP_tertile'] = participant_means[['COPc_integral_tertile', 'COPc_peak_mean_tertile']].mode(axis=1)[0]
participant_means['envelope_tertile'] = participant_means[['envelope_norm_integral_tertile', 'envelope_norm_peak_mean_tertile']].mode(axis=1)[0]
participant_means['overall_effort_score'] = participant_means.apply(lambda row: tertile_to_score(row['arm_tertile']) + tertile_to_score(row['COP_tertile']) + tertile_to_score(row['envelope_tertile']), axis=1)
participant_means['effort_category'] = participant_means['overall_effort_score'].apply(effort_category)
participants_effort_df = participant_means[['pcn_ID', 'effort_category', 'COP_tertile', 'arm_tertile', 'envelope_tertile']]

# save it
participants_effort_df.to_csv(os.path.join(datafolder, "participants_effort_df.csv"), index=False)
# how many per each effort category
participants_effort_df['effort_category'].value_counts()
effort_category
Medium Effort    71
High Effort      27
Low Effort       24
Name: count, dtype: int64

Arm torque integral

# load in data
features_df_nonz = pd.read_csv(os.path.join(datafolder, "features_df_nonzscored_final.csv"))
features_df_nonz['pcn_ID'] = features_df_nonz['TrialID'].str.split('_').str[0] + '_' + features_df_nonz['TrialID'].str.split('_').str[-1]

# merge with participants_effort_df to get effort_category
participants_effort_df = pd.read_csv(os.path.join(datafolder, "participants_effort_df.csv"))
features_df_nonz = features_df_nonz.merge(participants_effort_df[['pcn_ID', 'effort_category', 'COP_tertile', 'arm_tertile', 'envelope_tertile']], on='pcn_ID', how='left')

# Arm moment change integral
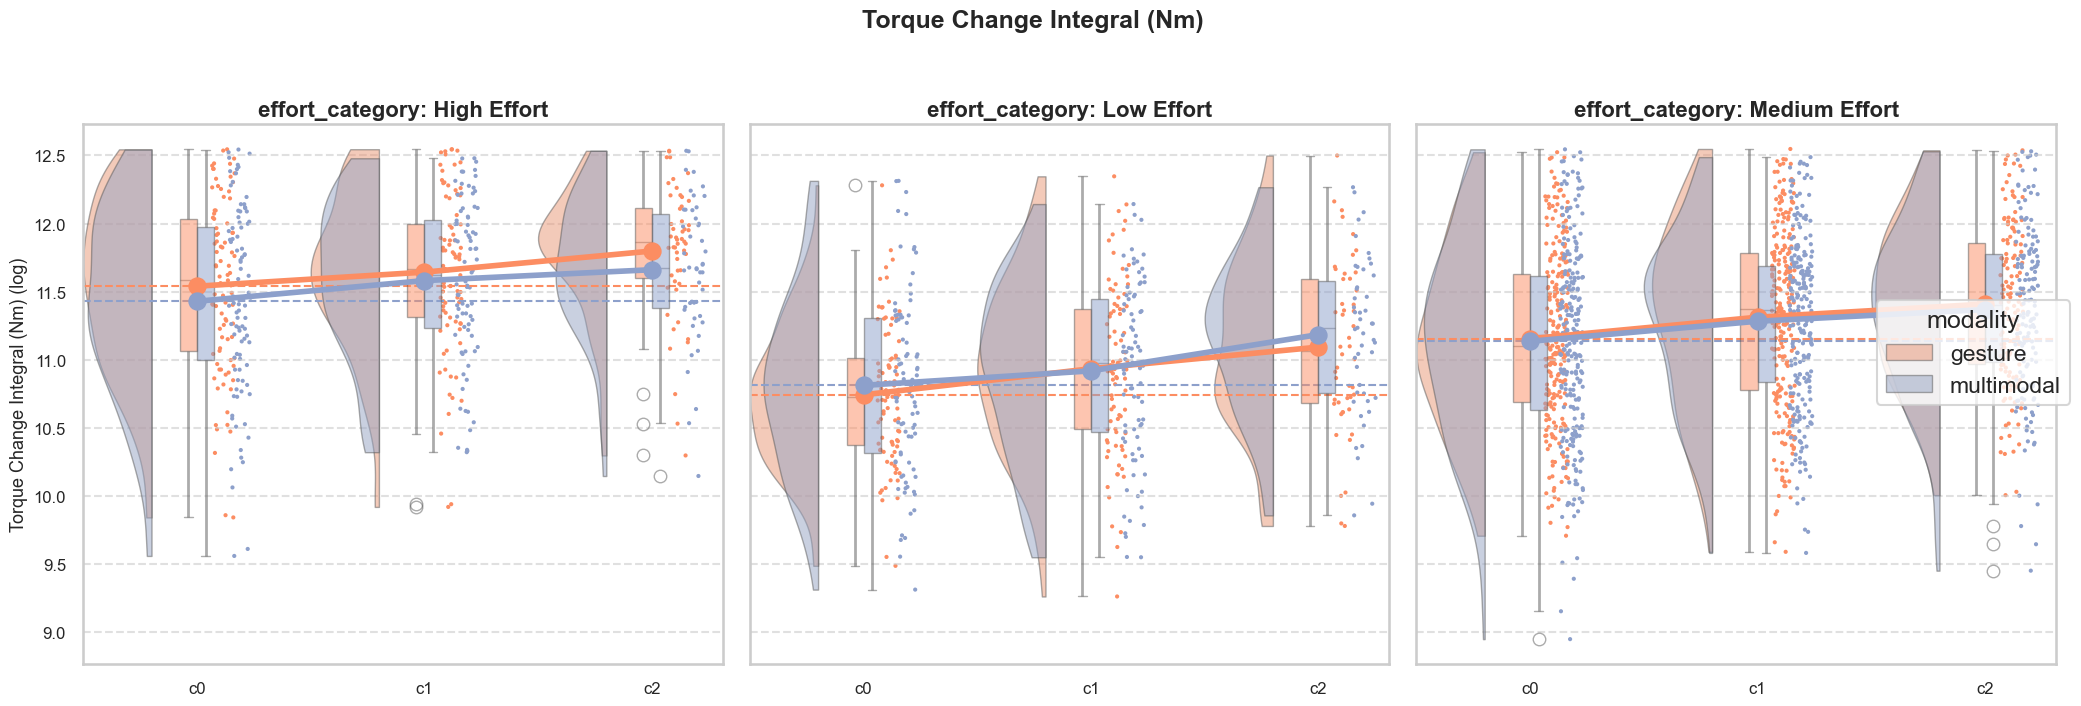
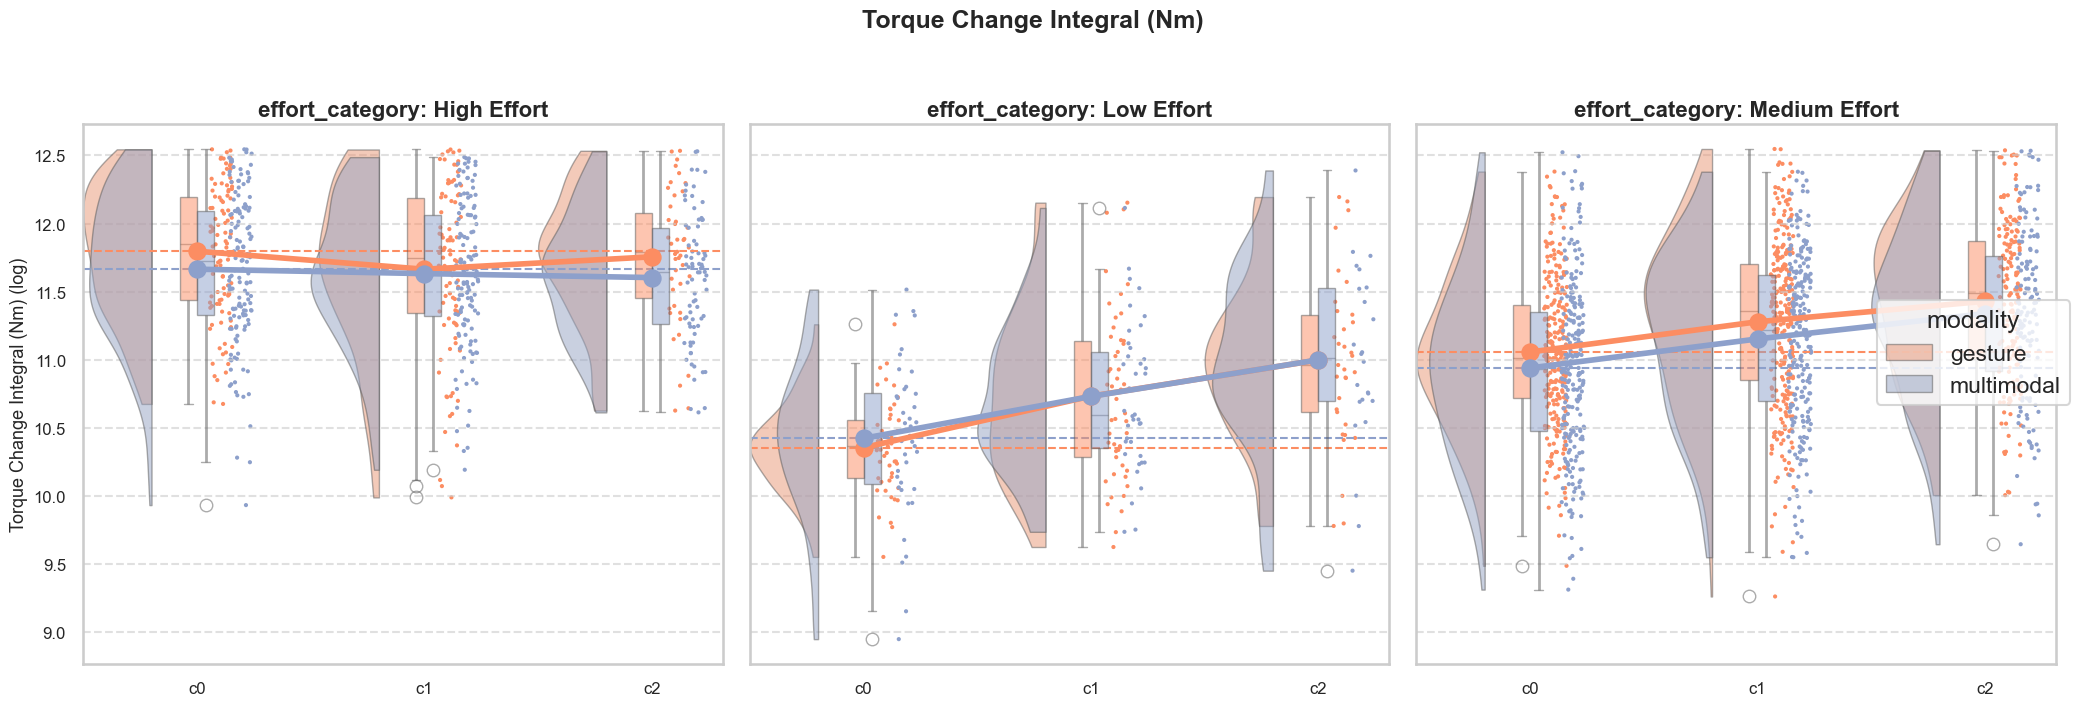
plot_raincloud_comparison_with_grids(features_df_nonz, var='arm_moment_sum_change_integral', var_to_display='Torque Change Integral (Nm)', grid_var='effort_category', log_transform=True, modalityout='vocal', correctionout='c0_only')

# the same but with arm_tertile instead
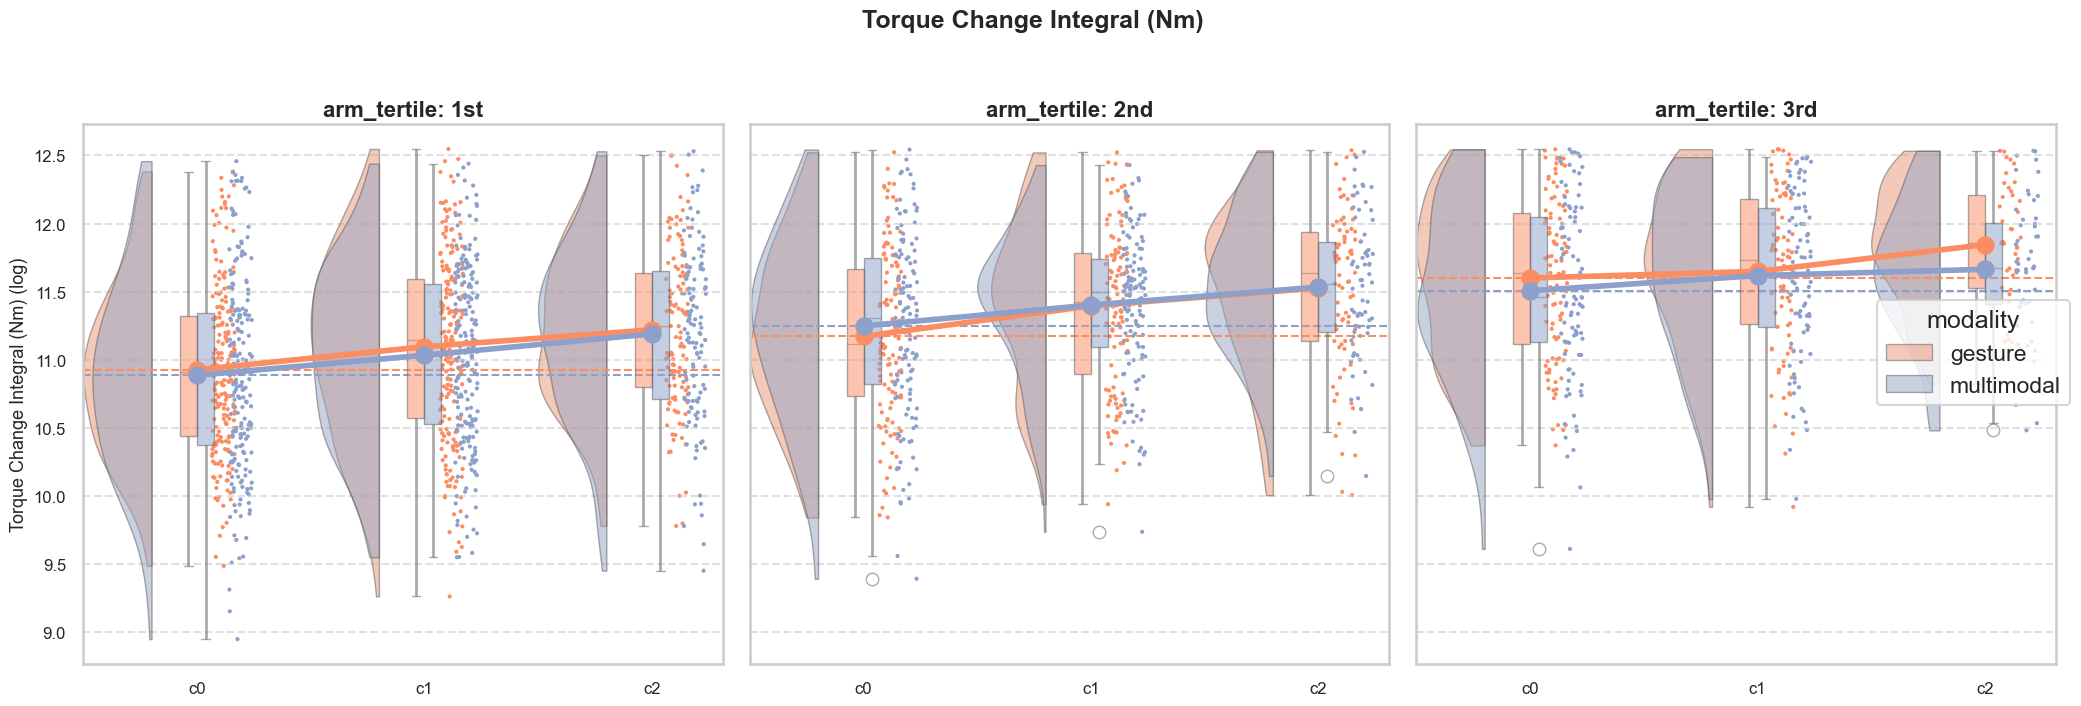
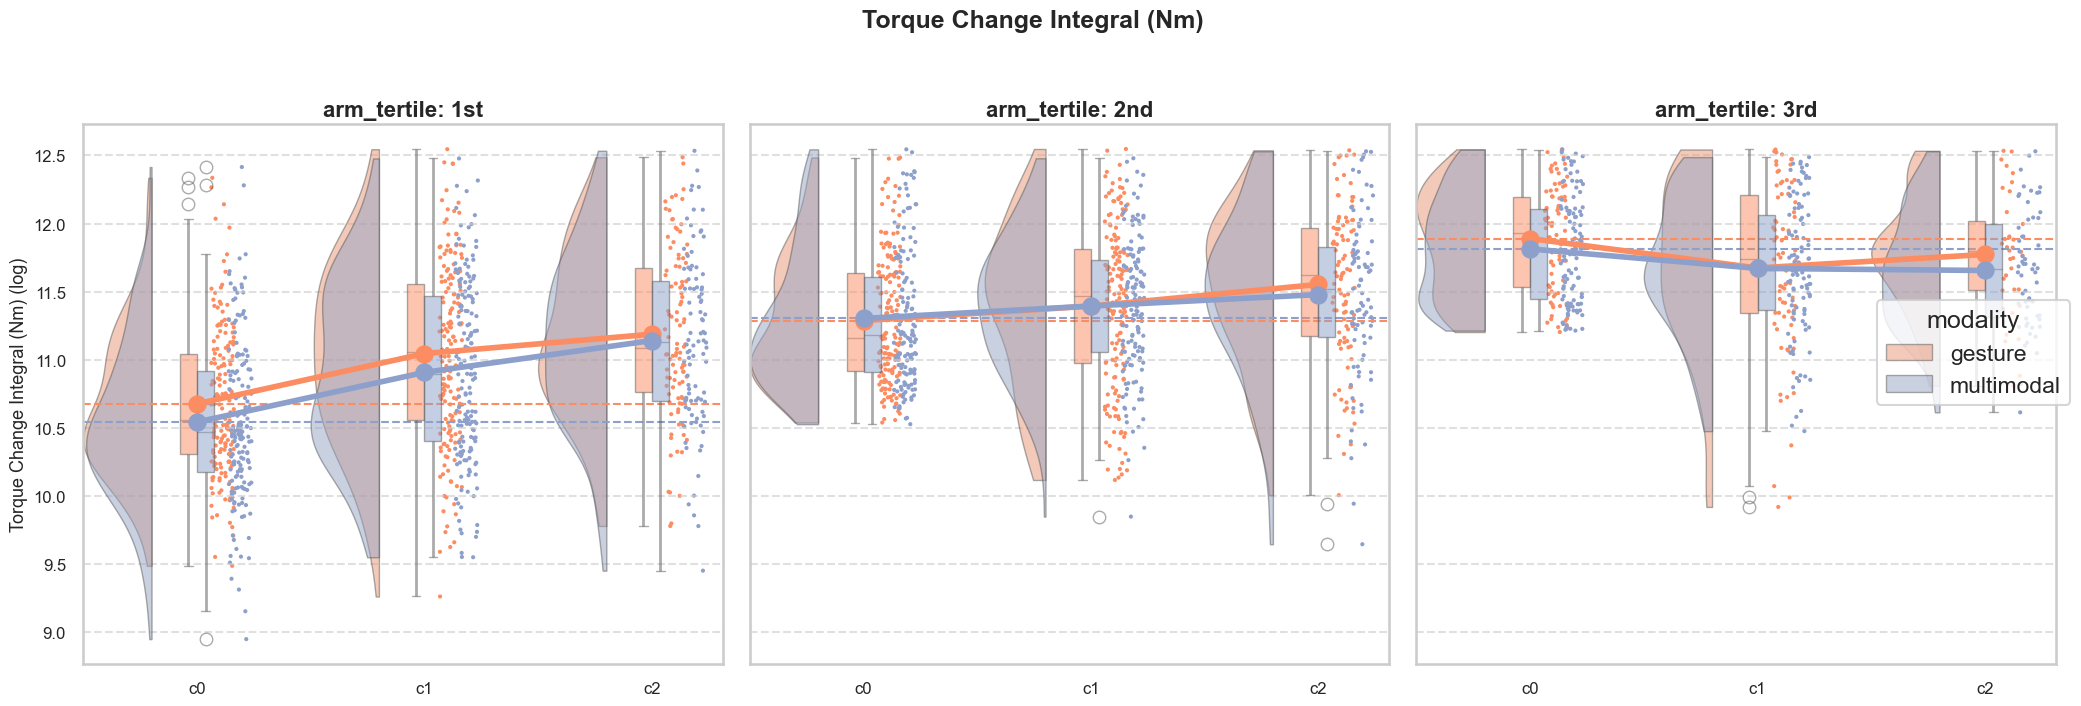
plot_raincloud_comparison_with_grids(features_df_nonz, var='arm_moment_sum_change_integral', var_to_display='Torque Change Integral (Nm)', grid_var='arm_tertile', log_transform=True, modalityout='vocal', correctionout='c0_only')
Removed 7.01% of data as outliers based on Torque Change Integral (Nm).

Removed 7.01% of data as outliers based on Torque Change Integral (Nm).

Arm torque peak mean

# load in data
features_df_nonz = pd.read_csv(os.path.join(datafolder, "features_df_nonzscored_final.csv"))
features_df_nonz['pcn_ID'] = features_df_nonz['TrialID'].str.split('_').str[0] + '_' + features_df_nonz['TrialID'].str.split('_').str[-1]

# merge with participants_effort_df to get effort_category
participants_effort_df = pd.read_csv(os.path.join(datafolder, "participants_effort_df.csv"))
features_df_nonz = features_df_nonz.merge(participants_effort_df[['pcn_ID', 'effort_category', 'COP_tertile', 'arm_tertile', 'envelope_tertile']], on='pcn_ID', how='left')

# Arm moment change peak mean
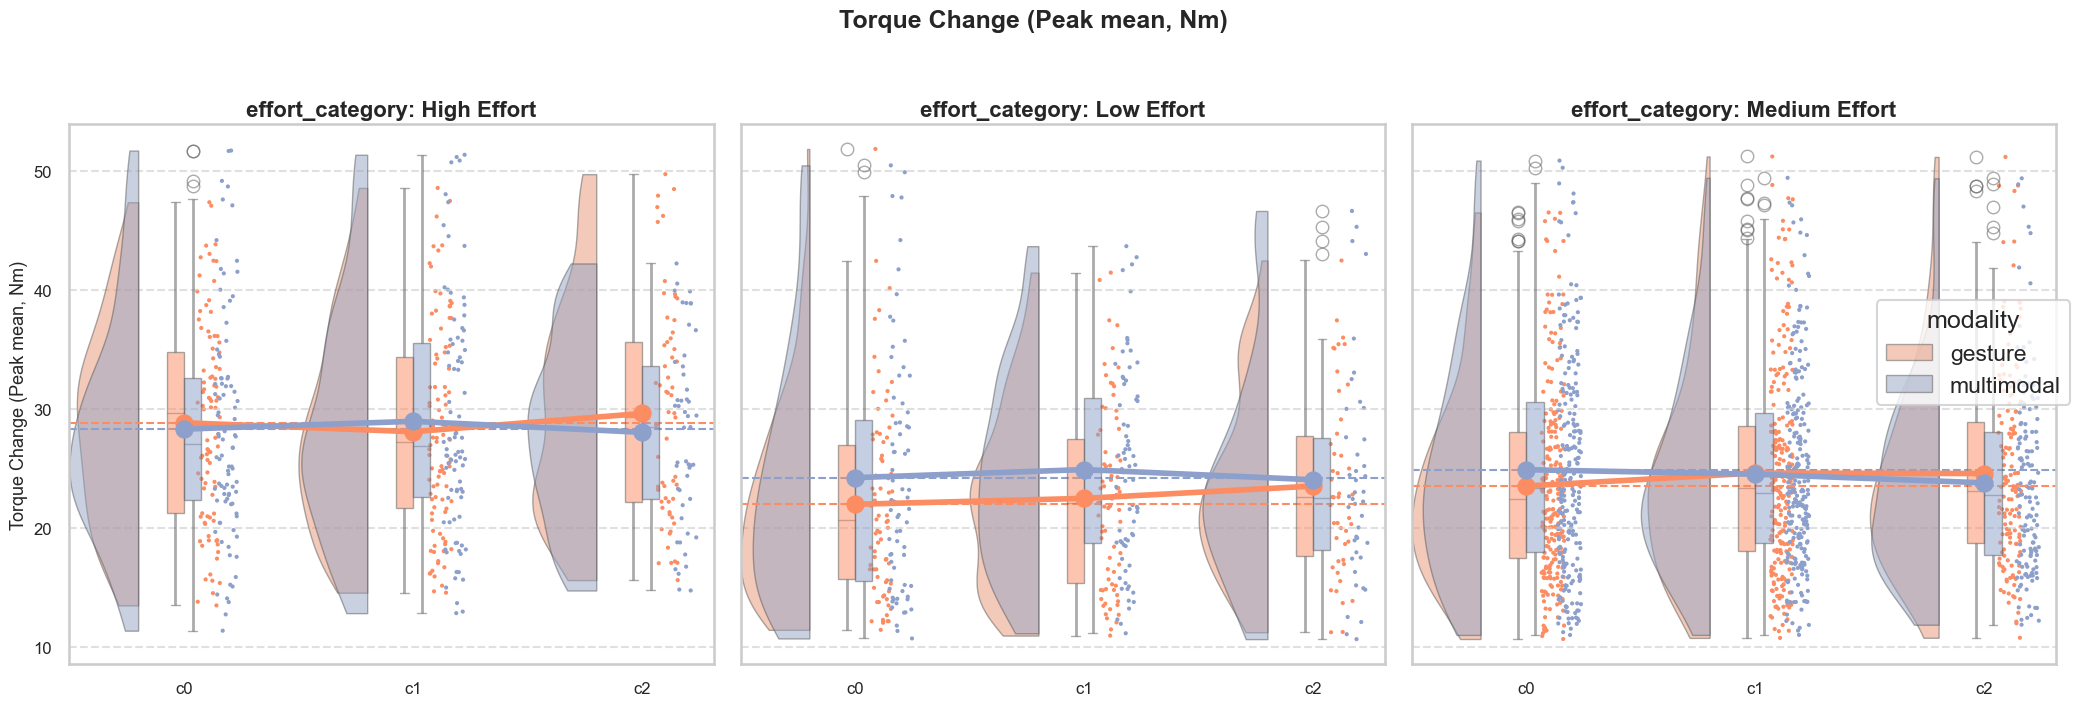
plot_raincloud_comparison_with_grids(features_df_nonz, var='arm_moment_sum_change_peak_mean', var_to_display='Torque Change (Peak mean, Nm)', grid_var='effort_category', log_transform=False, modalityout='vocal', correctionout='c0_only')

# the same but with arm_tertile instead
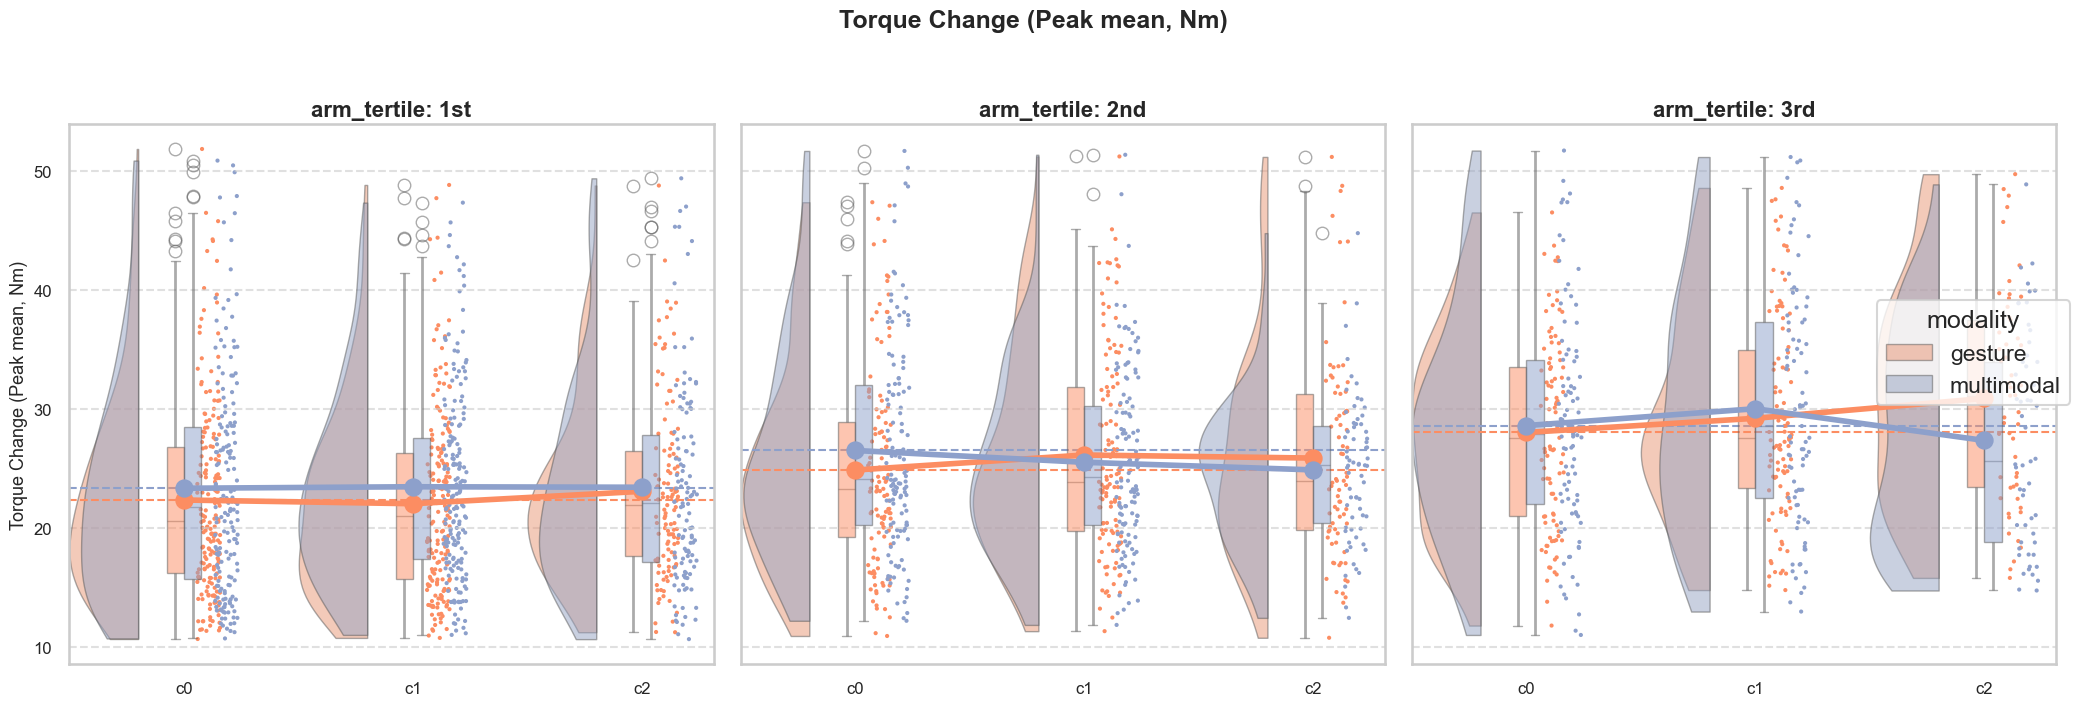
plot_raincloud_comparison_with_grids(features_df_nonz, var='arm_moment_sum_change_peak_mean', var_to_display='Torque Change (Peak mean, Nm)', grid_var='arm_tertile', log_transform=False, modalityout='vocal', correctionout='c0_only')
Removed 9.59% of data as outliers based on Torque Change (Peak mean, Nm).

Removed 9.59% of data as outliers based on Torque Change (Peak mean, Nm).

Envelope integral

# load in data
features_df_nonz = pd.read_csv(os.path.join(datafolder, "features_df_nonzscored_final.csv"))
features_df_nonz['pcn_ID'] = features_df_nonz['TrialID'].str.split('_').str[0] + '_' + features_df_nonz['TrialID'].str.split('_').str[-1]

# merge with participants_effort_df to get effort_category
participants_effort_df = pd.read_csv(os.path.join(datafolder, "participants_effort_df.csv"))
features_df_nonz = features_df_nonz.merge(participants_effort_df[['pcn_ID', 'effort_category', 'COP_tertile', 'arm_tertile', 'envelope_tertile']], on='pcn_ID', how='left')

# Envelope integral
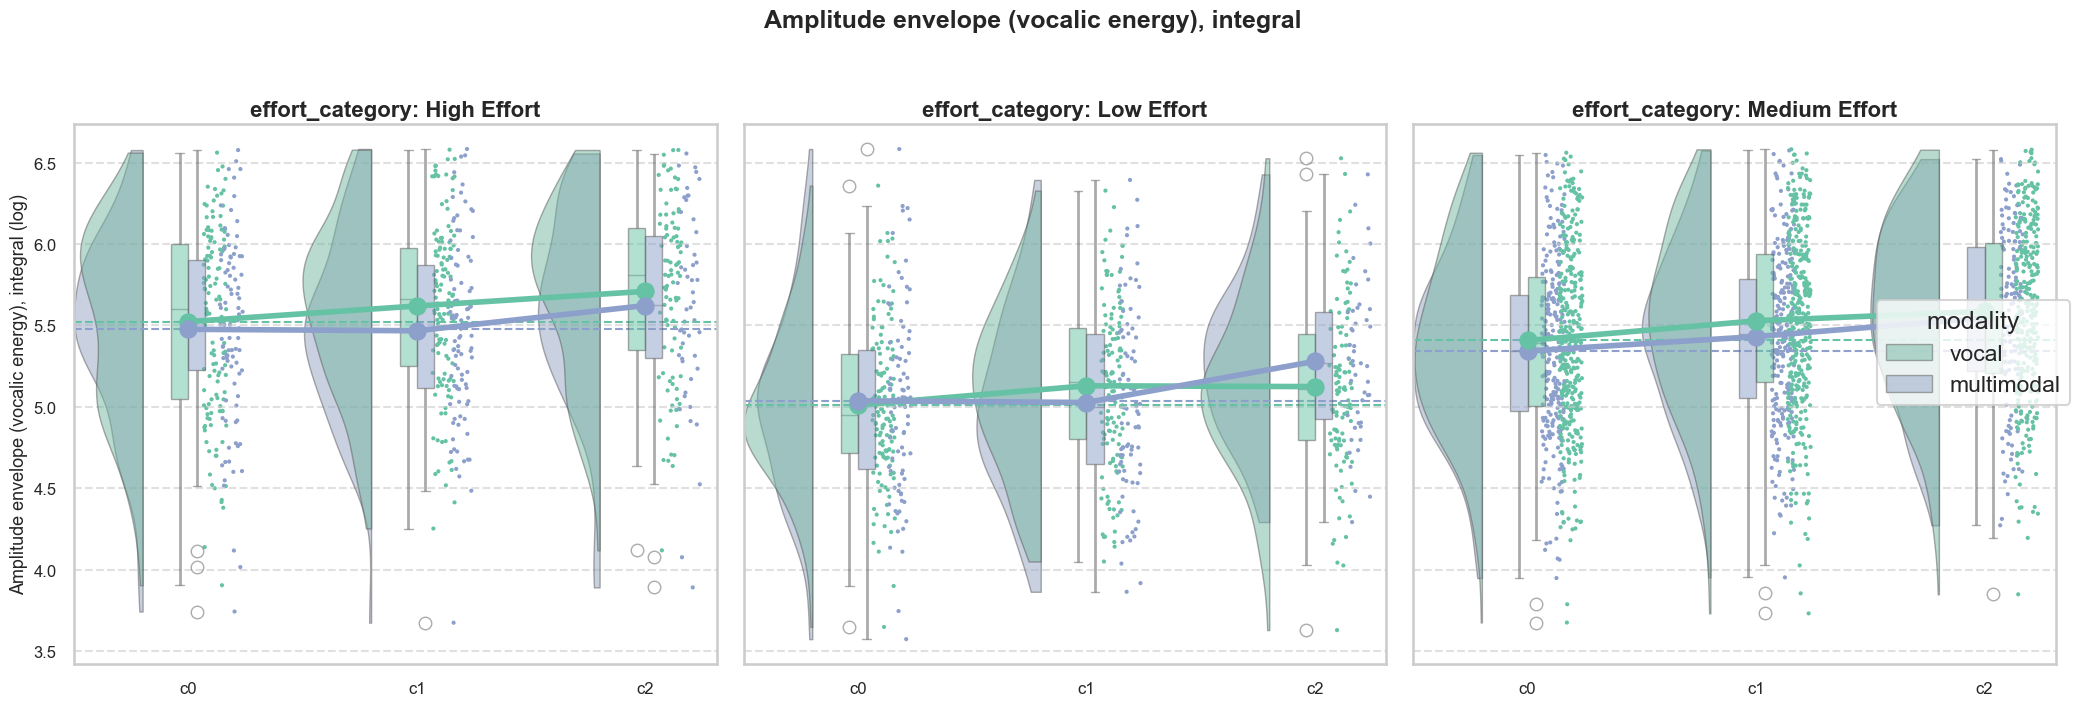
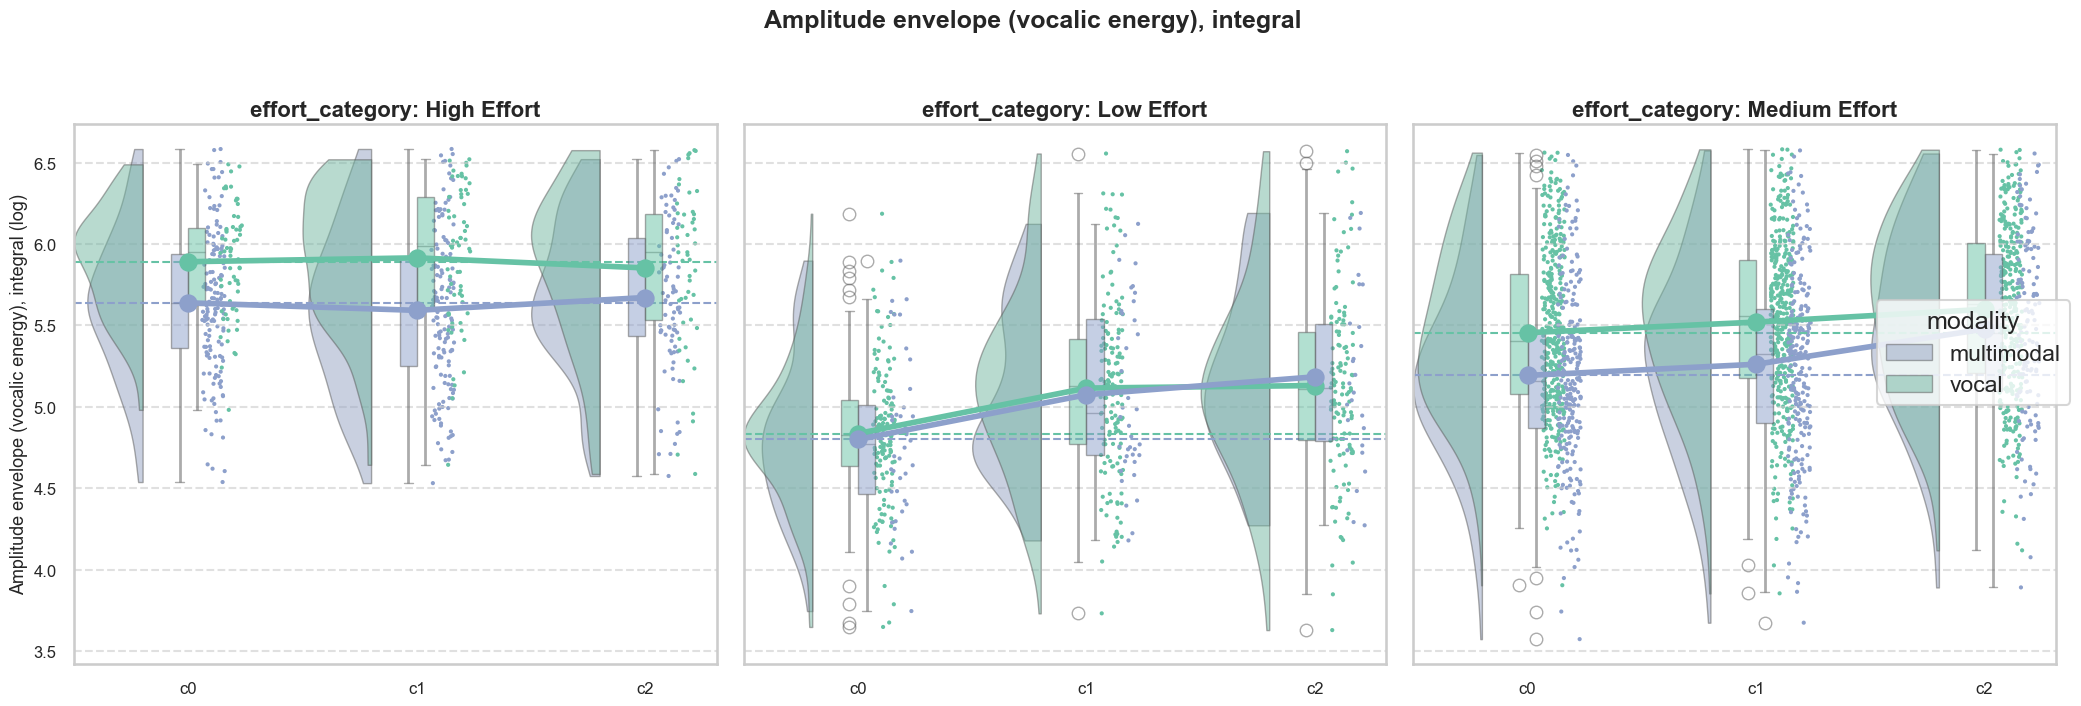
plot_raincloud_comparison_with_grids(features_df_nonz, var='envelope_norm_integral', var_to_display='Amplitude envelope (vocalic energy), integral', grid_var='effort_category', log_transform=True, modalityout='gesture', correctionout='c0_only')

# the same but with envelope_tertile instead
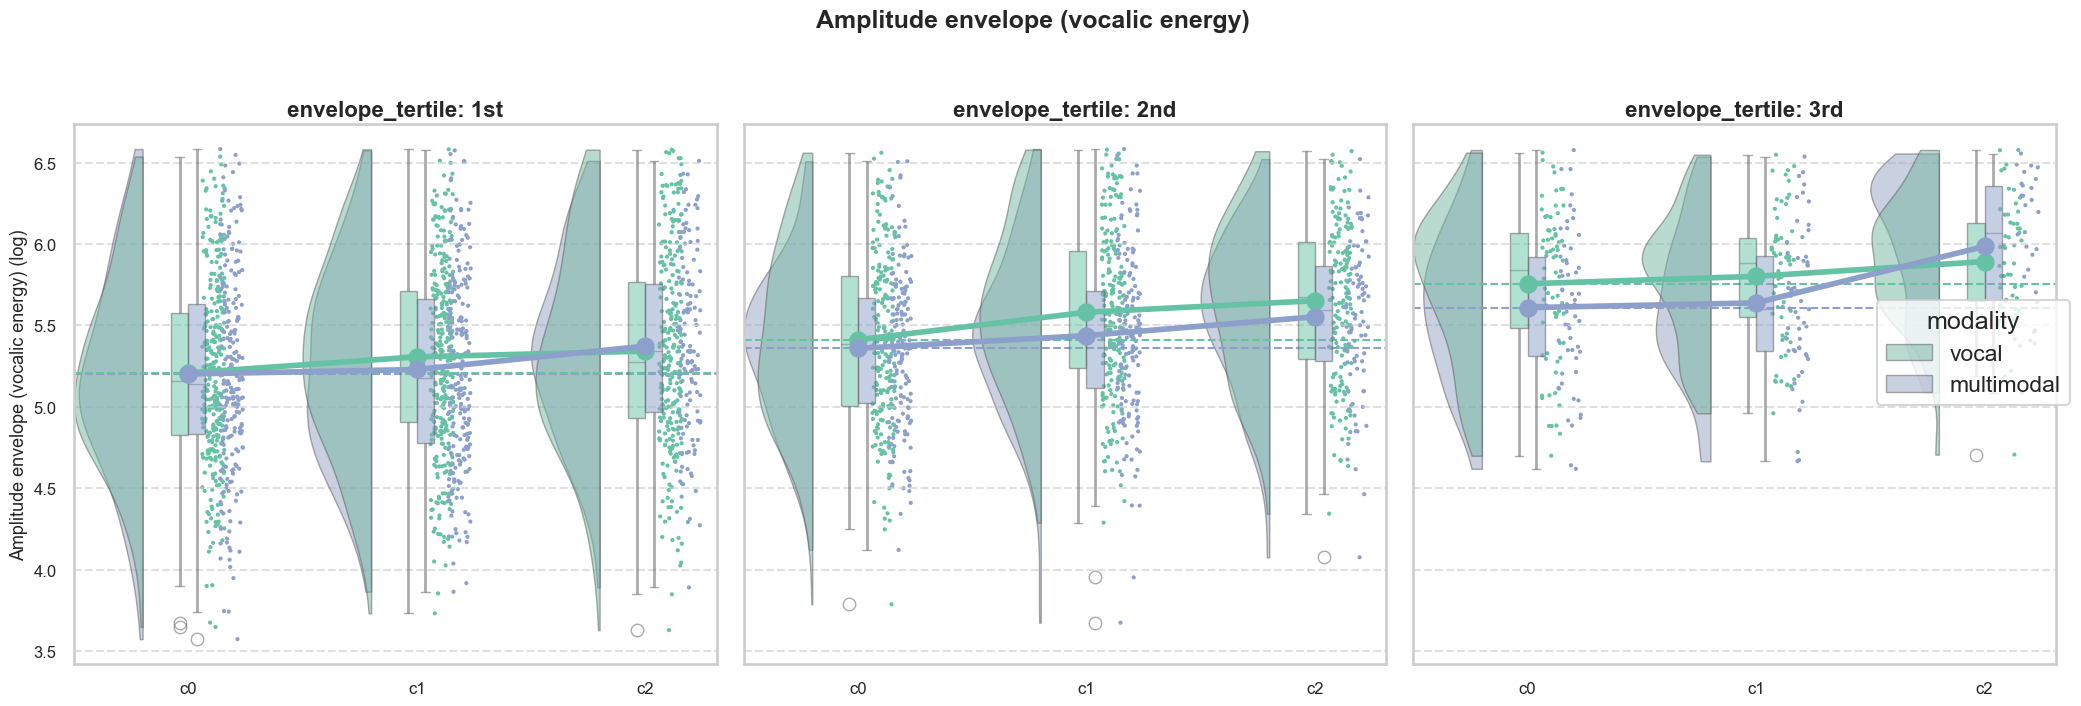
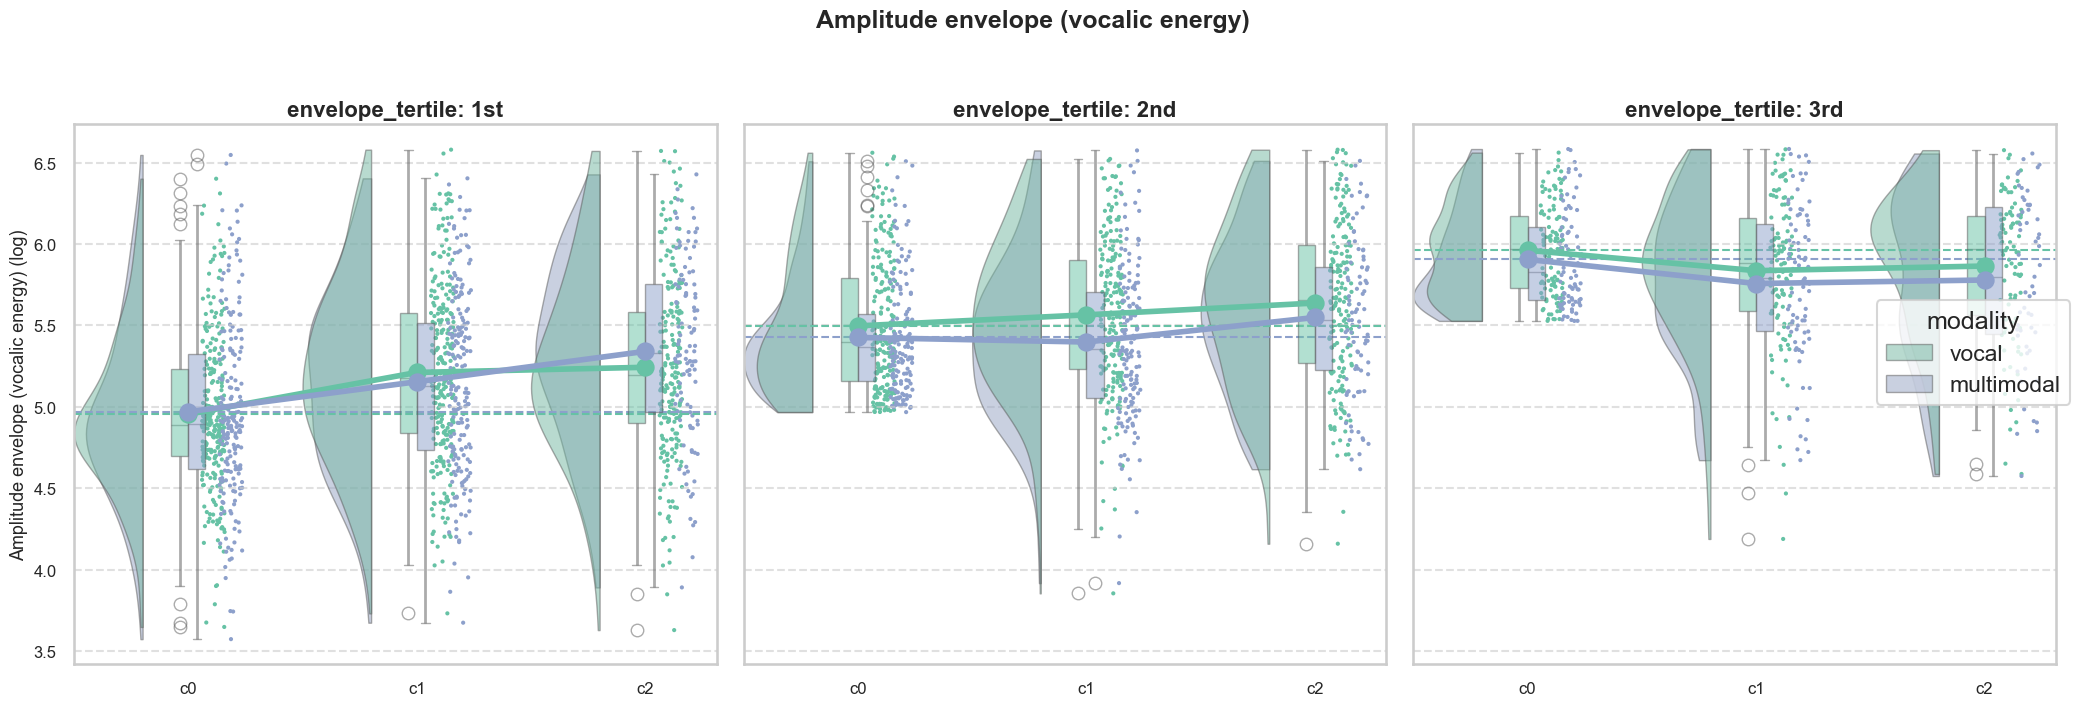
plot_raincloud_comparison_with_grids(features_df_nonz, var='envelope_norm_integral', var_to_display='Amplitude envelope (vocalic energy)', grid_var='envelope_tertile', log_transform=True, modalityout='gesture', correctionout='c0_only')
Removed 6.61% of data as outliers based on Amplitude envelope (vocalic energy), integral.

Removed 6.61% of data as outliers based on Amplitude envelope (vocalic energy).

Envelope peak mean

# load in data
features_df_nonz = pd.read_csv(os.path.join(datafolder, "features_df_nonzscored_final.csv"))
features_df_nonz['pcn_ID'] = features_df_nonz['TrialID'].str.split('_').str[0] + '_' + features_df_nonz['TrialID'].str.split('_').str[-1]

# merge with participants_effort_df to get effort_category
participants_effort_df = pd.read_csv(os.path.join(datafolder, "participants_effort_df.csv"))
features_df_nonz = features_df_nonz.merge(participants_effort_df[['pcn_ID', 'effort_category', 'COP_tertile', 'arm_tertile', 'envelope_tertile']], on='pcn_ID', how='left')

# Envelope peak mean
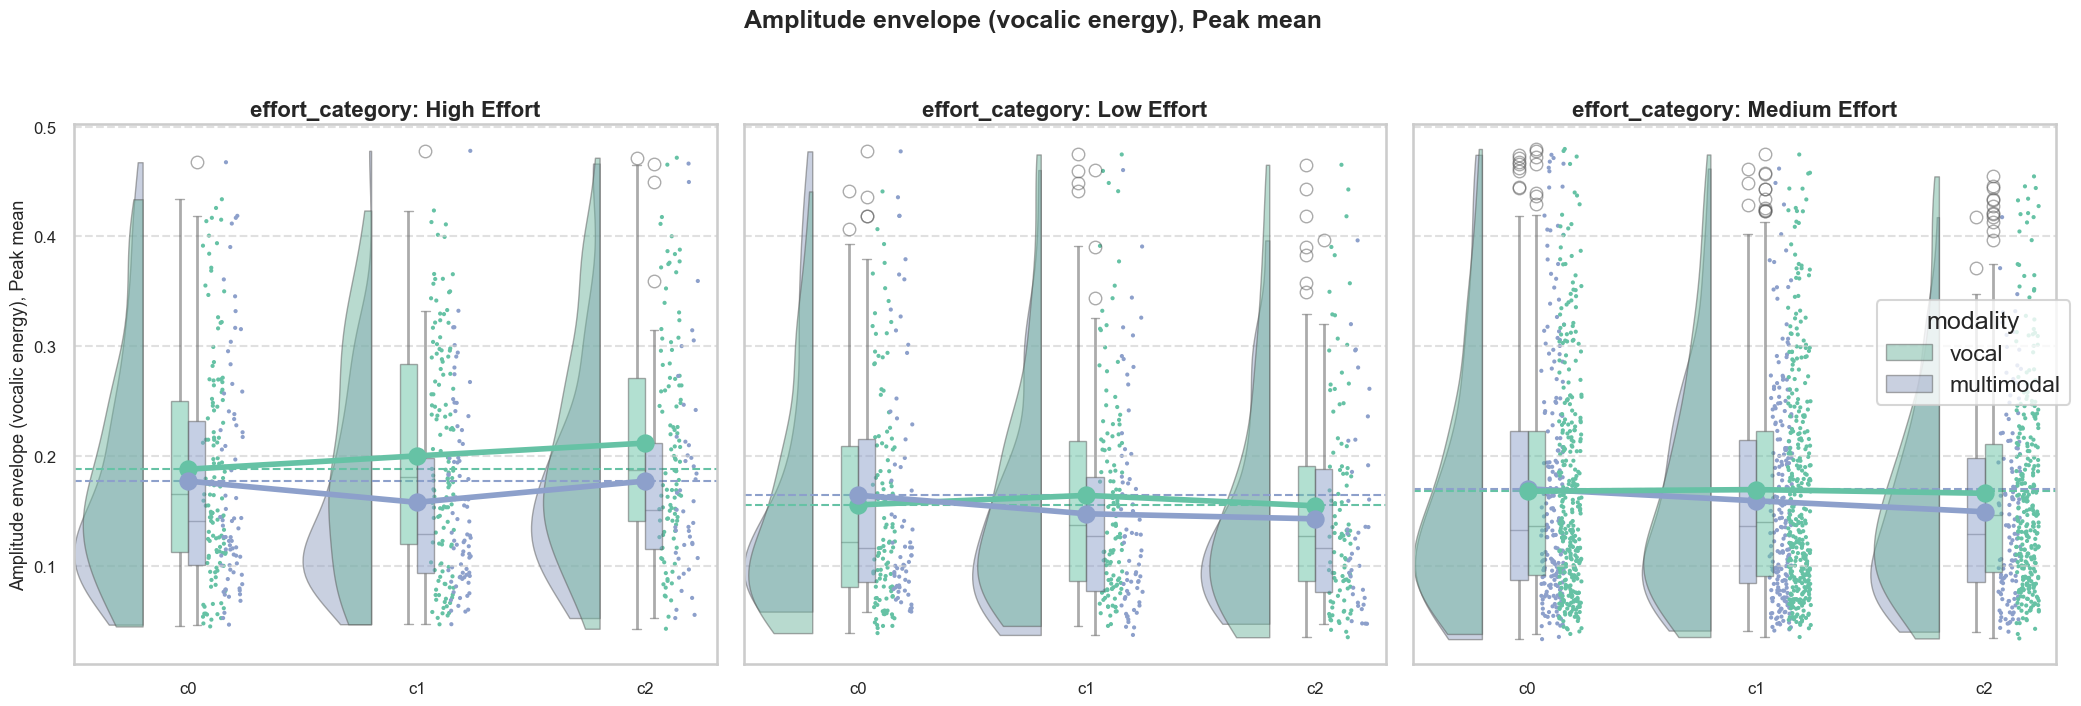
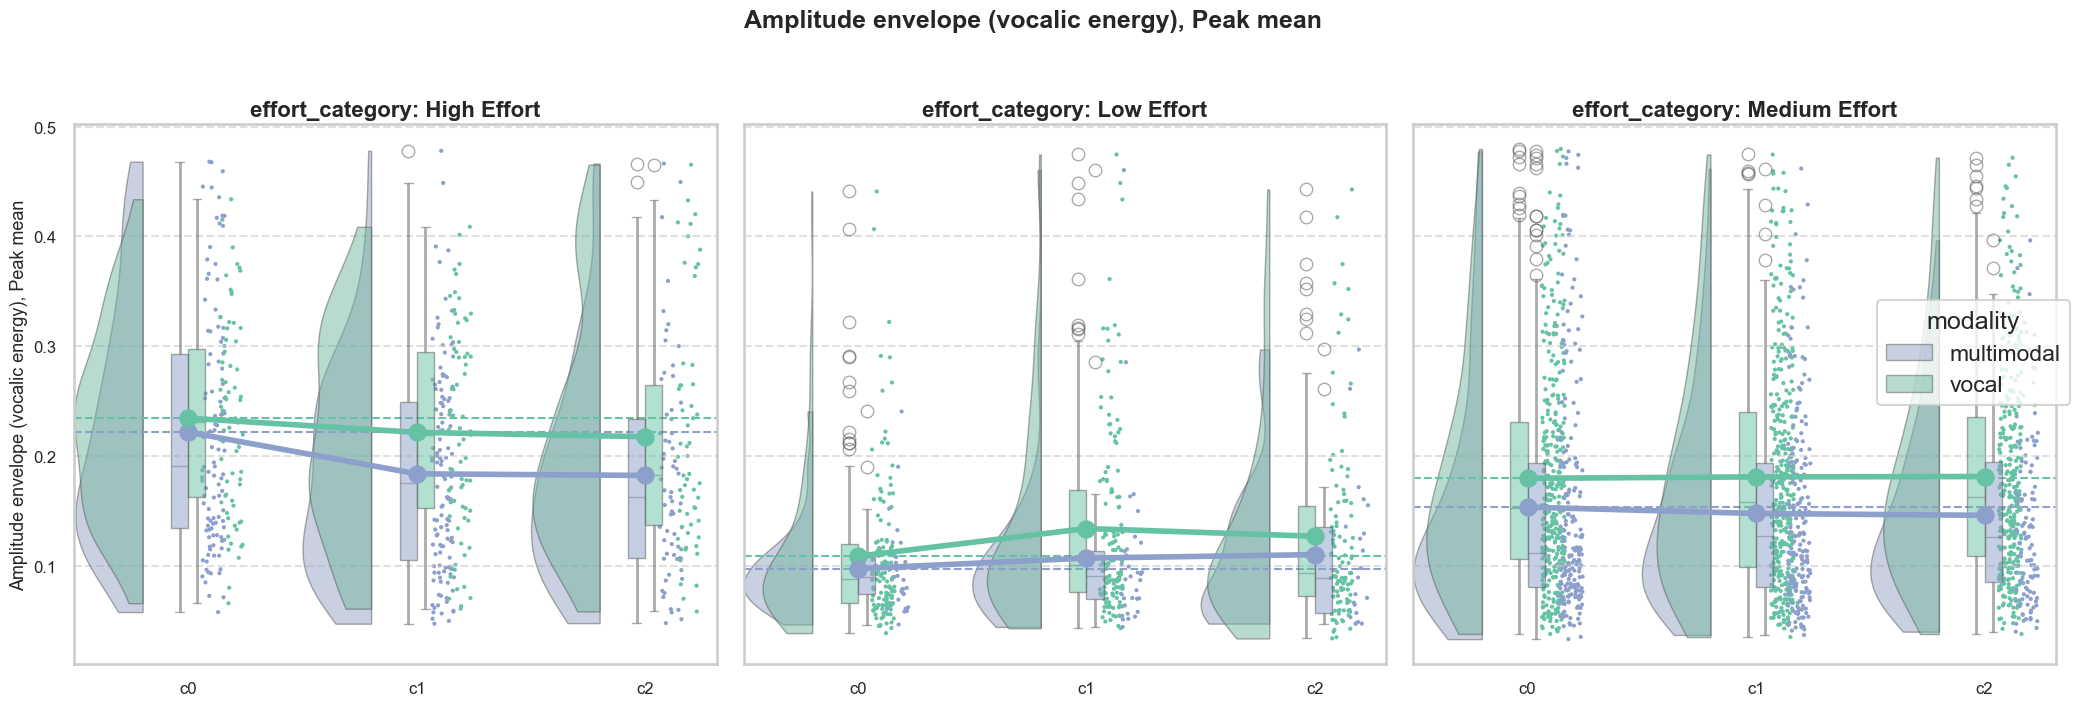
plot_raincloud_comparison_with_grids(features_df_nonz, var='envelope_norm_peak_mean', var_to_display='Amplitude envelope (vocalic energy), Peak mean', grid_var='effort_category', log_transform=False, modalityout='gesture', correctionout='c0_only')

# the same but with envelope_tertile instead
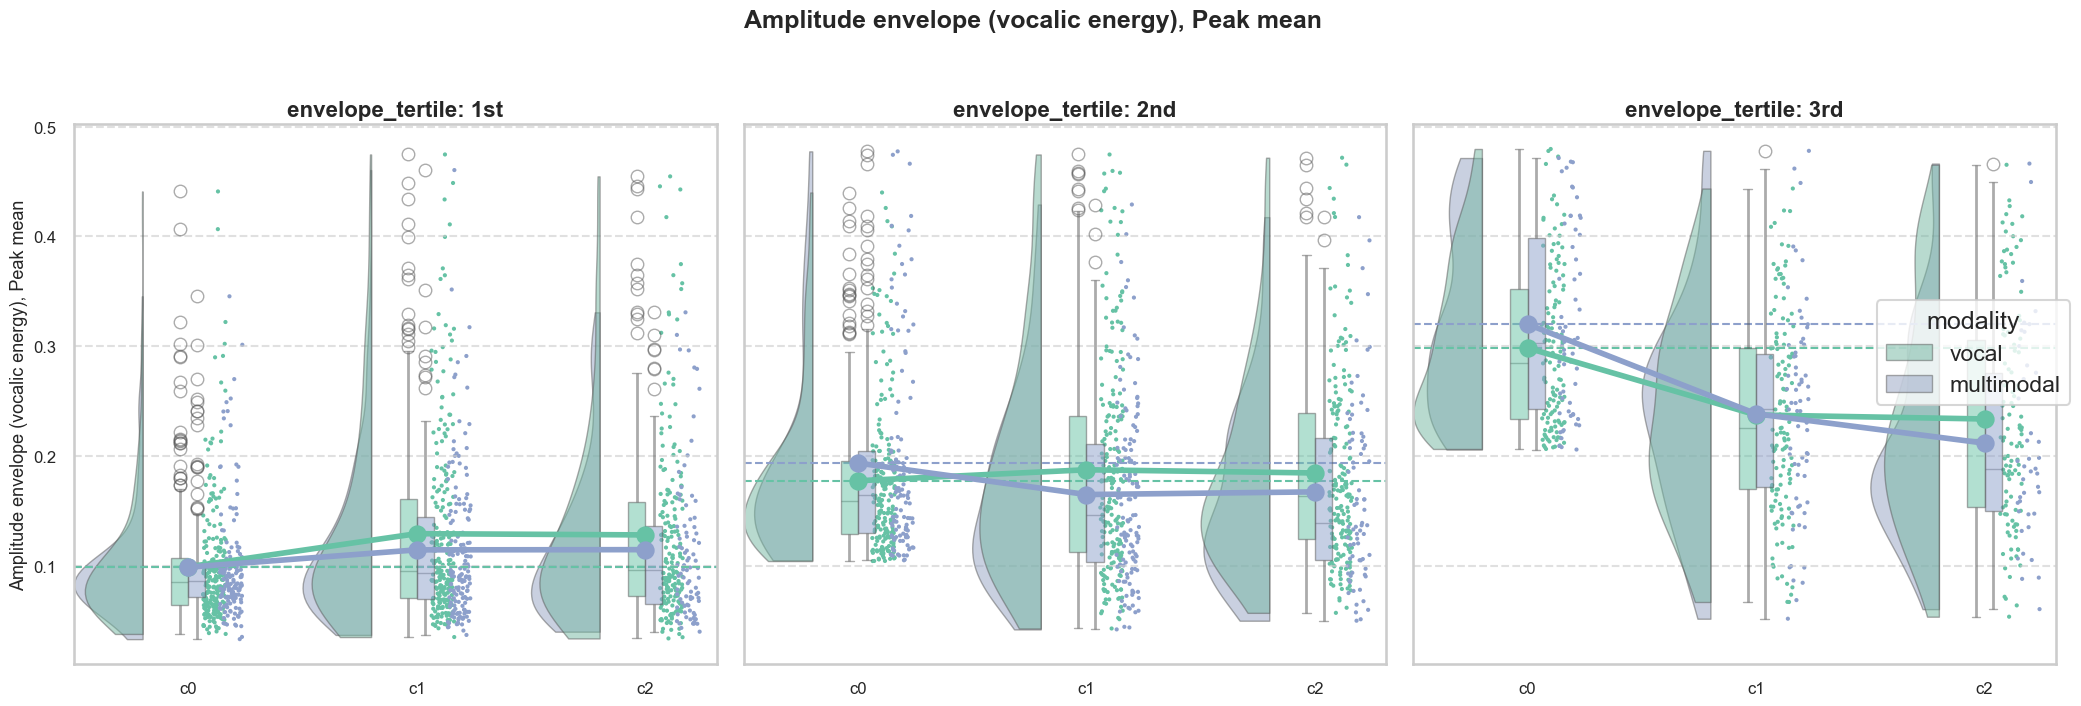
plot_raincloud_comparison_with_grids(features_df_nonz, var='envelope_norm_peak_mean', var_to_display='Amplitude envelope (vocalic energy), Peak mean', grid_var='envelope_tertile', log_transform=False, modalityout='gesture', correctionout='c0_only')
Removed 15.52% of data as outliers based on Amplitude envelope (vocalic energy), Peak mean.

Removed 15.52% of data as outliers based on Amplitude envelope (vocalic energy), Peak mean.

COPc integral

# load in data
features_df_nonz = pd.read_csv(os.path.join(datafolder, "features_df_nonzscored_final.csv"))
features_df_nonz['pcn_ID'] = features_df_nonz['TrialID'].str.split('_').str[0] + '_' + features_df_nonz['TrialID'].str.split('_').str[-1]

# merge with participants_effort_df to get effort_category
participants_effort_df = pd.read_csv(os.path.join(datafolder, "participants_effort_df.csv"))
features_df_nonz = features_df_nonz.merge(participants_effort_df[['pcn_ID', 'effort_category', 'COP_tertile', 'arm_tertile', 'envelope_tertile']], on='pcn_ID', how='left')

# COPc integral
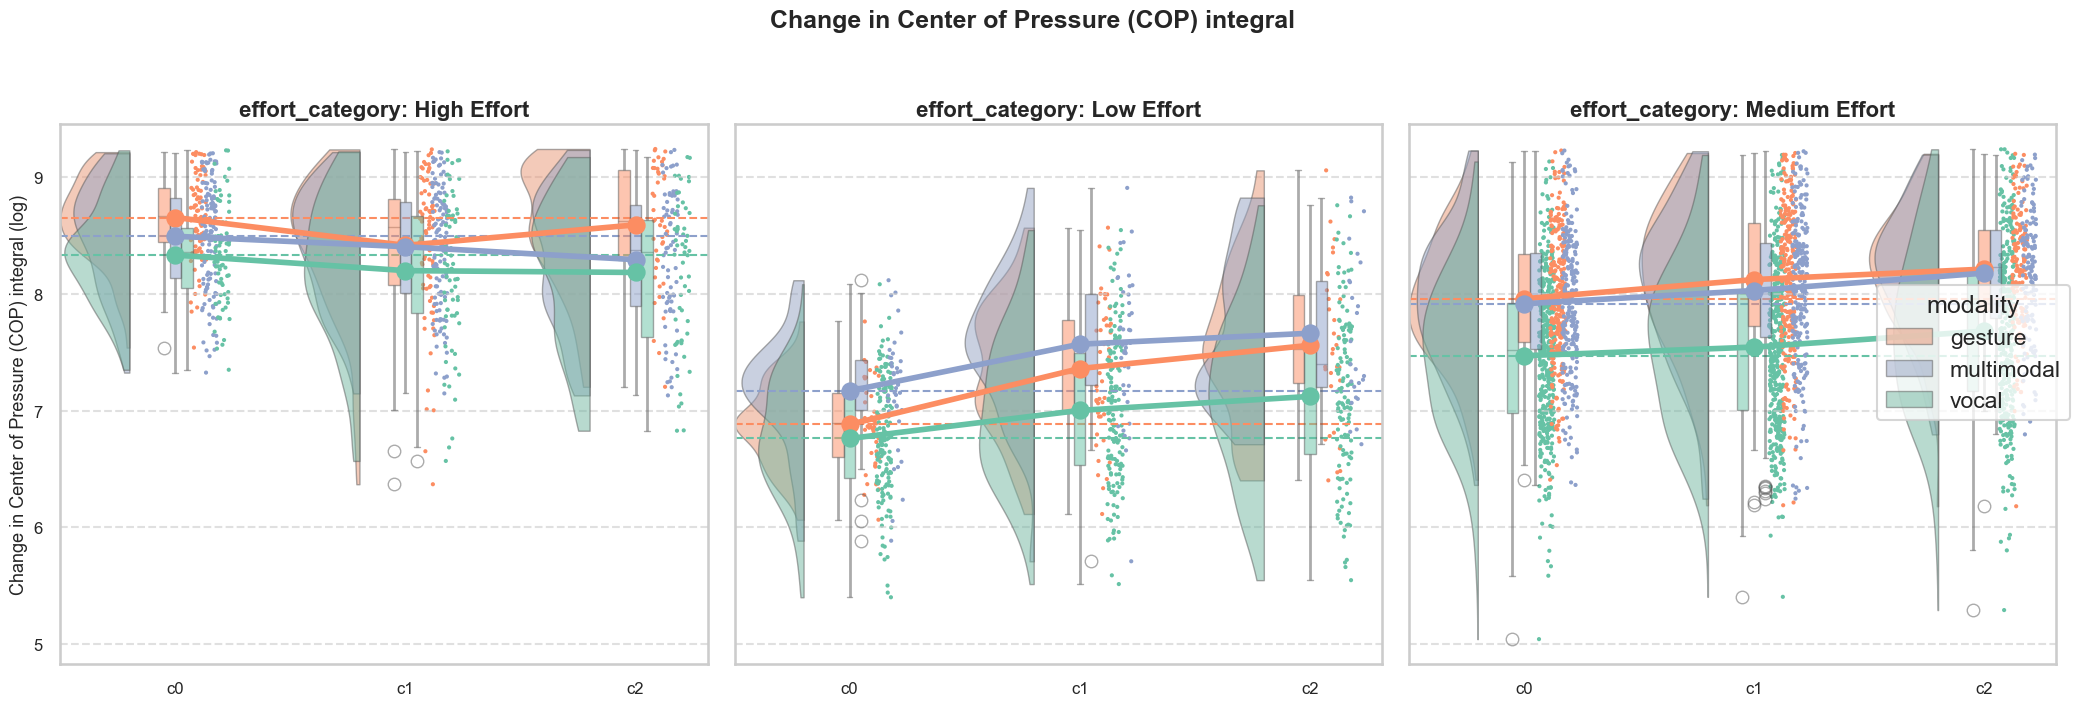
plot_raincloud_comparison_with_grids(features_df_nonz, var='COPc_integral', var_to_display='Change in Center of Pressure (COP) integral', grid_var='effort_category', log_transform=True, modalityout='', correctionout='c0_only')

# the same but with COP_tertile instead
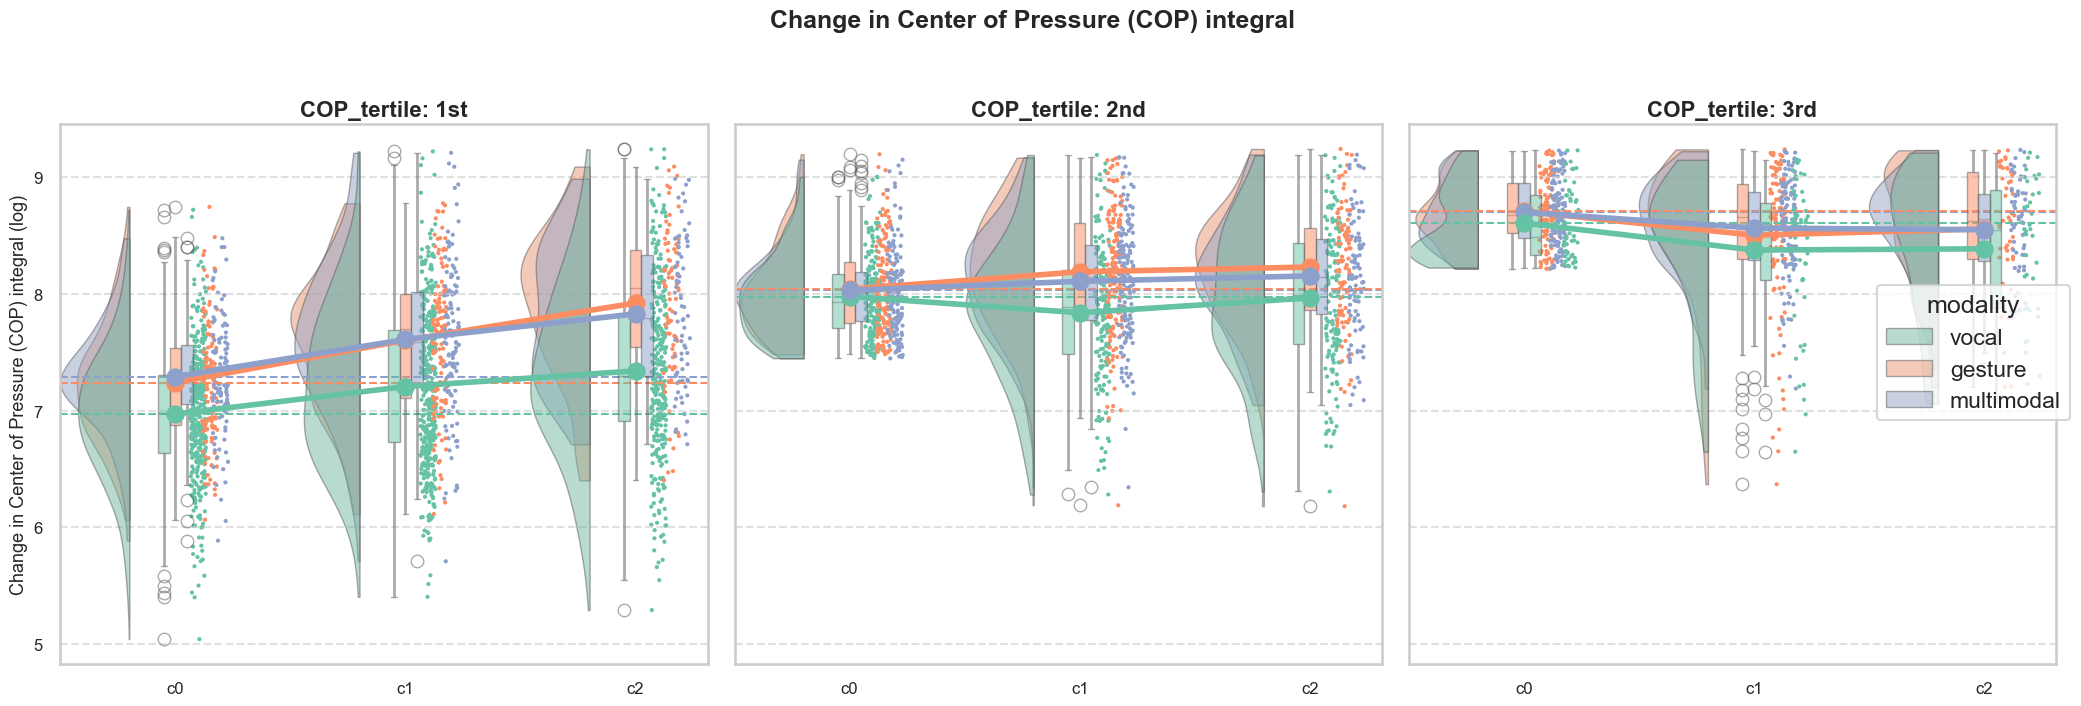
plot_raincloud_comparison_with_grids(features_df_nonz, var='COPc_integral', var_to_display='Change in Center of Pressure (COP) integral', grid_var='COP_tertile', log_transform=True, modalityout='', correctionout='c0_only')
Removed 7.31% of data as outliers based on Change in Center of Pressure (COP) integral.

Removed 7.31% of data as outliers based on Change in Center of Pressure (COP) integral.

COPc peak mean

# load in data
features_df_nonz = pd.read_csv(os.path.join(datafolder, "features_df_nonzscored_final.csv"))
features_df_nonz['pcn_ID'] = features_df_nonz['TrialID'].str.split('_').str[0] + '_' + features_df_nonz['TrialID'].str.split('_').str[-1]

# merge with participants_effort_df to get effort_category
participants_effort_df = pd.read_csv(os.path.join(datafolder, "participants_effort_df.csv"))
features_df_nonz = features_df_nonz.merge(participants_effort_df[['pcn_ID', 'effort_category', 'COP_tertile', 'arm_tertile', 'envelope_tertile']], on='pcn_ID', how='left')

# COPc peak mean
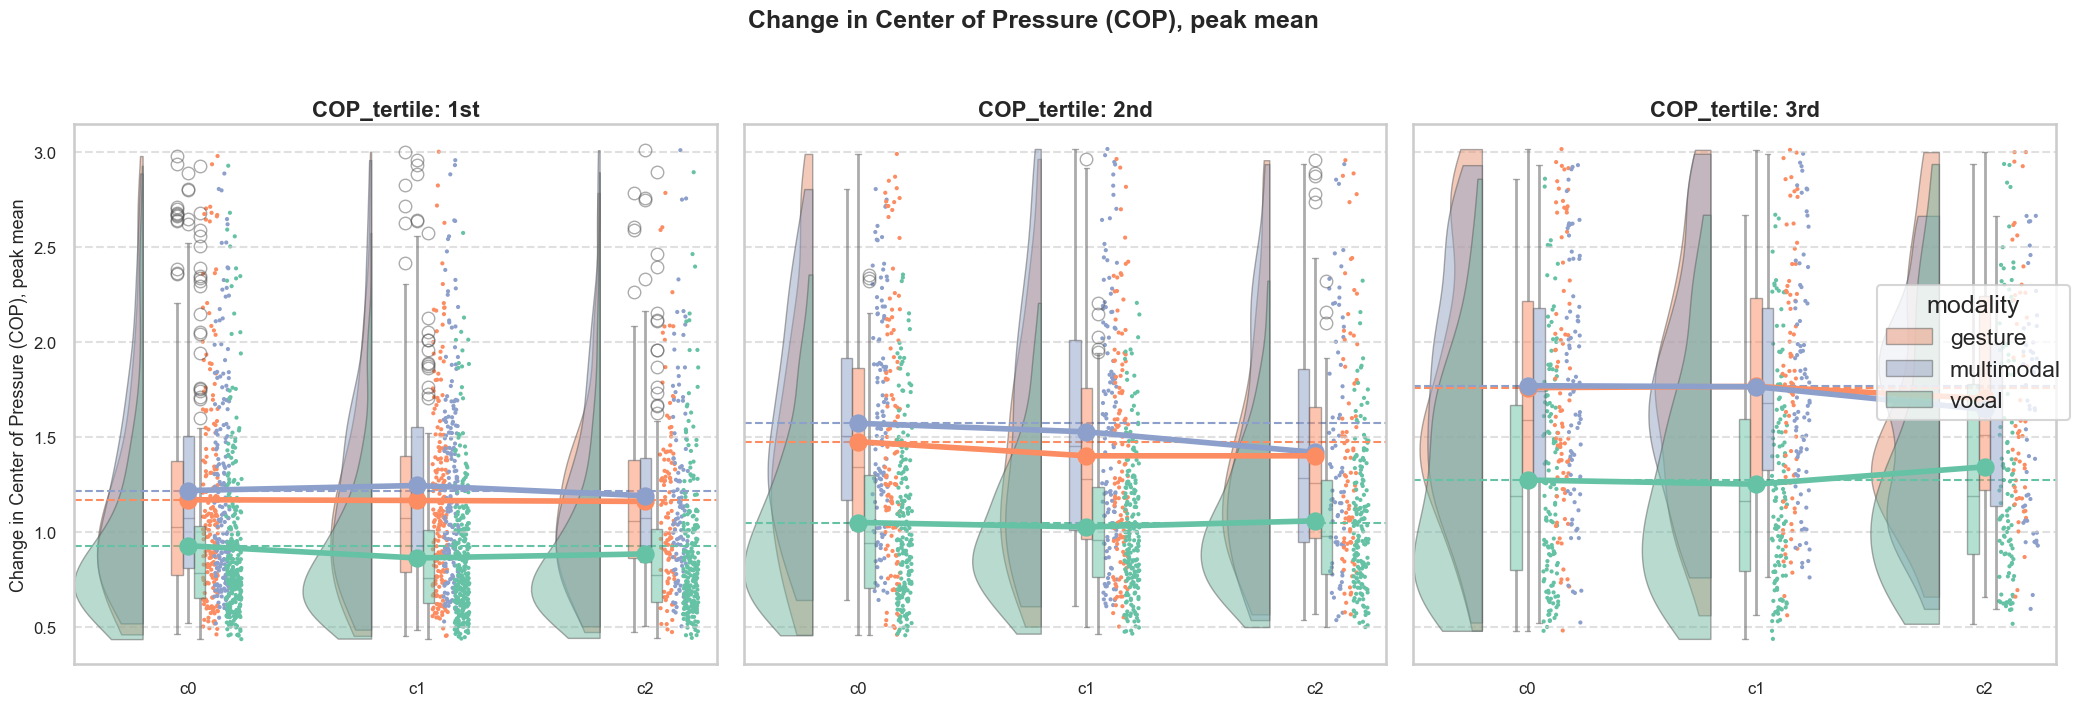
plot_raincloud_comparison_with_grids(features_df_nonz, var='COPc_peak_mean', var_to_display='Change in Center of Pressure (COP), peak mean', grid_var='effort_category', log_transform=False, modalityout='', correctionout='c0_only')

# the same but with COP_tertile instead
plot_raincloud_comparison_with_grids(features_df_nonz, var='COPc_peak_mean', var_to_display='Change in Center of Pressure (COP), peak mean', grid_var='COP_tertile', log_transform=False, modalityout='', correctionout='c0_only')
Removed 8.59% of data as outliers based on Change in Center of Pressure (COP), peak mean.

Removed 8.59% of data as outliers based on Change in Center of Pressure (COP), peak mean.

Bin by effortfullness in the first trial

data = pd.read_csv(os.path.join(datafolder, "features_df_nonzscored_final.csv"))
data_c0 = data[data['correction_info'] == 'c0']

# columns of interest
coi = ['TrialID', 'modality', 'arm_moment_sum_change_integral', 'envelope_norm_integral', 'COPc_integral', 'arm_moment_sum_change_peak_mean', 'COPc_peak_mean', 'envelope_norm_peak_mean']
data_c0 = data_c0[coi]

# plot distriution of each feature per modality in a grid
features_to_plot = ['arm_moment_sum_change_integral', 'envelope_norm_integral', 'COPc_integral', 'arm_moment_sum_change_peak_mean', 'COPc_peak_mean', 'envelope_norm_peak_mean']
num_features = len(features_to_plot)
num_cols = 3
num_rows = (num_features + num_cols - 1) // num_cols
sns.set_context("talk")  # Larger font scale
sns.set_style("whitegrid", {'axes.grid': True, 'grid.linestyle': '--'})
plt.figure(figsize=(18, num_rows * 5))
for i, feature in enumerate(features_to_plot):
    plt.subplot(num_rows, num_cols, i + 1)
    sns.kdeplot(
        data=data_c0,
        x=feature,
        hue='modality',
        palette=modality_palette,
        fill=True,
        common_norm=False,
        alpha=0.5
    )
    plt.title(feature, fontsize=16)
    plt.xlabel('')
    plt.ylabel('Density')
plt.tight_layout()
plt.show()
def tertile_to_score(tertile):
    """Convert tertile label to numerical score (1, 2, or 3). Returns NaN for invalid input."""
    if tertile == '1st':
        return 1
    elif tertile == '2nd':
        return 2
    elif tertile == '3rd':
        return 3
    else:
        return np.nan
    
def effort_category(score):
    """Convert numerical effort score to categorical label.
    Returns 'Low Effort' for scores < 4, 'Medium Effort' for 4-6, 'High Effort' for >=7.
    Returns NaN for invalid input."""
    if score < 4:
        return 'Low Effort'
    elif score >= 4 and score <= 6:
        return 'Medium Effort'
    elif score >= 7:
        return 'High Effort'
    else:
        return np.nan
    
def modality_specific_effort_category(score):
    """Convert numerical modality-specific effort score to categorical label.
    Returns 'Low Effort' for scores < 2, 'Medium Effort' for 2-3, 'High Effort' for >=3.
    Returns NaN for invalid input."""
    if score < 2:
        return 'Low Effort'
    elif score >= 2 and score < 3:
        return 'Medium Effort'
    elif score >= 3:
        return 'High Effort'
    else:
        print(score)
        return np.nan

# categorize each feature by tertiles
for feature in features_to_plot:
    tertiles = data_c0[feature].quantile([0.33, 0.66])
    data_c0[feature + '_tertile'] = pd.cut(data_c0[feature], bins=[-np.inf, tertiles[0.33], tertiles[0.66], np.inf], labels=['1st', '2nd', '3rd'])

# make a mean tertile per pairs of features (eg arm integral+peak, COP integral+peak, envelope integral+peak)
data_c0['arm_tertile'] = data_c0[['arm_moment_sum_change_integral_tertile', 'arm_moment_sum_change_peak_mean_tertile']].mode(axis=1)[0]
data_c0['COP_tertile'] = data_c0[['COPc_integral_tertile', 'COPc_peak_mean_tertile']].mode(axis=1)[0]
data_c0['envelope_tertile'] = data_c0[['envelope_norm_integral_tertile', 'envelope_norm_peak_mean_tertile']].mode(axis=1)[0]
data_c0['overall_effort_score'] = data_c0.apply(lambda row: tertile_to_score(row['arm_tertile']) + tertile_to_score(row['COP_tertile']) + tertile_to_score(row['envelope_tertile']), axis=1)
data_c0['modality_specific_effort_score'] = data_c0.apply(modality_specific_effort_score, axis=1)
data_c0['effort_category'] = data_c0['overall_effort_score'].apply(effort_category)
data_c0['modality_specific_effort_category'] = data_c0['modality_specific_effort_score'].apply(modality_specific_effort_category)

# keep only TrialID, effort_category, and the tertiles
data_c0_effort = data_c0[['TrialID', 'effort_category', 'modality_specific_effort_category', 'COP_tertile', 'arm_tertile', 'envelope_tertile']]
# save it
data_c0_effort.to_csv(os.path.join(datafolder, "data_c0_effort.csv"), index=False)
data = pd.read_csv(os.path.join(datafolder, "features_df_nonzscored_final.csv"))
data_c0_effort = pd.read_csv(os.path.join(datafolder, "data_c0_effort.csv"))

# merge on TrialID
data_merged = data.merge(data_c0_effort, on='TrialID', how='left')

# update concept_id
data_merged['concept_id'] = data_merged['TrialID'].str.split('_').str[0] + '_' + data_merged['concept_id']

# propagate effort_category, COP_tertile, arm_tertile, envelope_tertile to all rows of the same concept_id
data_merged[['effort_category', 'modality_specific_effort_category', 'COP_tertile', 'arm_tertile', 'envelope_tertile']] = data_merged.groupby('concept_id')[['effort_category', 'modality_specific_effort_category', 'COP_tertile', 'arm_tertile', 'envelope_tertile']].transform('first')

Arm moment integral

data = pd.read_csv(os.path.join(datafolder, "features_df_nonzscored_final.csv"))
data_c0_effort = pd.read_csv(os.path.join(datafolder, "data_c0_effort.csv"))

# merge on TrialID
data_merged = data.merge(data_c0_effort, on='TrialID', how='left')

# update concept_id
data_merged['concept_id'] = data_merged['TrialID'].str.split('_').str[0] + '_' + data_merged['concept_id']

# propagate effort_category, COP_tertile, arm_tertile, envelope_tertile to all rows of the same concept_id
data_merged[['effort_category', 'modality_specific_effort_category', 'COP_tertile', 'arm_tertile', 'envelope_tertile']] = data_merged.groupby('concept_id')[['effort_category', 'modality_specific_effort_category', 'COP_tertile', 'arm_tertile', 'envelope_tertile']].transform('first')

# Arm moment change integral
plot_raincloud_comparison_with_grids(data_merged, var='arm_moment_sum_change_integral', var_to_display='Torque Change Integral (Nm)', grid_var='effort_category', log_transform=True, modalityout='vocal', correctionout='c0_only')

# the same but with arm_tertile instead
plot_raincloud_comparison_with_grids(data_merged, var='arm_moment_sum_change_integral', var_to_display='Torque Change Integral (Nm)', grid_var='arm_tertile', log_transform=True, modalityout='vocal', correctionout='c0_only')

# Modality specific effort score
plot_raincloud_comparison_with_grids(data_merged, var='arm_moment_sum_change_integral', var_to_display='Torque Change Integral (Nm)', grid_var='modality_specific_effort_category', log_transform=True, modalityout='vocal', correctionout='c0_only')
Removed 7.01% of data as outliers based on Torque Change Integral (Nm).

Removed 7.01% of data as outliers based on Torque Change Integral (Nm).

Removed 7.01% of data as outliers based on Torque Change Integral (Nm).

Arm moment peak mean

data = pd.read_csv(os.path.join(datafolder, "features_df_nonzscored_final.csv"))
data_c0_effort = pd.read_csv(os.path.join(datafolder, "data_c0_effort.csv"))

# merge on TrialID
data_merged = data.merge(data_c0_effort, on='TrialID', how='left')

# update concept_id
data_merged['concept_id'] = data_merged['TrialID'].str.split('_').str[0] + '_' + data_merged['concept_id']

# propagate effort_category, COP_tertile, arm_tertile, envelope_tertile to all rows of the same concept_id
data_merged[['effort_category', 'modality_specific_effort_category', 'COP_tertile', 'arm_tertile', 'envelope_tertile']] = data_merged.groupby('concept_id')[['effort_category', 'modality_specific_effort_category', 'COP_tertile', 'arm_tertile', 'envelope_tertile']].transform('first')

# Arm moment change peak mean
plot_raincloud_comparison_with_grids(data_merged, var='arm_moment_sum_change_peak_mean', var_to_display='Torque Change (Peak mean, Nm)', grid_var='effort_category', log_transform=False, modalityout='vocal', correctionout='c0_only')

# the same but with arm_tertile instead
plot_raincloud_comparison_with_grids(data_merged, var='arm_moment_sum_change_peak_mean', var_to_display='Torque Change (Peak mean, Nm)', grid_var='arm_tertile', log_transform=False, modalityout='vocal', correctionout='c0_only')

# Modality specific effort score
plot_raincloud_comparison_with_grids(data_merged, var='arm_moment_sum_change_peak_mean', var_to_display='Torque Change (Peak mean, Nm)', grid_var='modality_specific_effort_category', log_transform=False, modalityout='vocal', correctionout='c0_only')
Removed 9.59% of data as outliers based on Torque Change (Peak mean, Nm).

Removed 9.59% of data as outliers based on Torque Change (Peak mean, Nm).

Removed 9.59% of data as outliers based on Torque Change (Peak mean, Nm).

Envelope integral

data = pd.read_csv(os.path.join(datafolder, "features_df_nonzscored_final.csv"))
data_c0_effort = pd.read_csv(os.path.join(datafolder, "data_c0_effort.csv"))

# merge on TrialID
data_merged = data.merge(data_c0_effort, on='TrialID', how='left')

# update concept_id
data_merged['concept_id'] = data_merged['TrialID'].str.split('_').str[0] + '_' + data_merged['concept_id']

# propagate effort_category, COP_tertile, arm_tertile, envelope_tertile to all rows of the same concept_id
data_merged[['effort_category', 'modality_specific_effort_category', 'COP_tertile', 'arm_tertile', 'envelope_tertile']] = data_merged.groupby('concept_id')[['effort_category', 'modality_specific_effort_category', 'COP_tertile', 'arm_tertile', 'envelope_tertile']].transform('first')

# Envelope integral
plot_raincloud_comparison_with_grids(data_merged, var='envelope_norm_integral', var_to_display='Amplitude envelope (vocalic energy), integral', grid_var='effort_category', log_transform=True, modalityout='gesture', correctionout='c0_only')

# the same but with envelope_tertile instead
plot_raincloud_comparison_with_grids(data_merged, var='envelope_norm_integral', var_to_display='Amplitude envelope (vocalic energy)', grid_var='envelope_tertile', log_transform=True, modalityout='gesture', correctionout='c0_only')

# modality specific effort score
plot_raincloud_comparison_with_grids(data_merged, var='envelope_norm_integral', var_to_display='Amplitude envelope (vocalic energy)', grid_var='modality_specific_effort_category', log_transform=True, modalityout='gesture', correctionout='c0_only')
Removed 6.61% of data as outliers based on Amplitude envelope (vocalic energy), integral.

Removed 6.61% of data as outliers based on Amplitude envelope (vocalic energy).

Removed 6.61% of data as outliers based on Amplitude envelope (vocalic energy).

Envelope peak mean

data = pd.read_csv(os.path.join(datafolder, "features_df_nonzscored_final.csv"))
data_c0_effort = pd.read_csv(os.path.join(datafolder, "data_c0_effort.csv"))

# merge on TrialID
data_merged = data.merge(data_c0_effort, on='TrialID', how='left')

# update concept_id
data_merged['concept_id'] = data_merged['TrialID'].str.split('_').str[0] + '_' + data_merged['concept_id']

# propagate effort_category, COP_tertile, arm_tertile, envelope_tertile to all rows of the same concept_id
data_merged[['effort_category', 'modality_specific_effort_category', 'COP_tertile', 'arm_tertile', 'envelope_tertile']] = data_merged.groupby('concept_id')[['effort_category', 'modality_specific_effort_category', 'COP_tertile', 'arm_tertile', 'envelope_tertile']].transform('first')

# Envelope peak mean
plot_raincloud_comparison_with_grids(data_merged, var='envelope_norm_peak_mean', var_to_display='Amplitude envelope (vocalic energy), Peak mean', grid_var='effort_category', log_transform=False, modalityout='gesture', correctionout='c0_only')

# the same but with envelope_tertile instead
plot_raincloud_comparison_with_grids(data_merged, var='envelope_norm_peak_mean', var_to_display='Amplitude envelope (vocalic energy), Peak mean', grid_var='envelope_tertile', log_transform=False, modalityout='gesture', correctionout='c0_only')

# modality specific effort score
plot_raincloud_comparison_with_grids(data_merged, var='envelope_norm_peak_mean', var_to_display='Amplitude envelope (vocalic energy), Peak mean', grid_var='modality_specific_effort_category', log_transform=False, modalityout='gesture', correctionout='c0_only')
Removed 15.52% of data as outliers based on Amplitude envelope (vocalic energy), Peak mean.

Removed 15.52% of data as outliers based on Amplitude envelope (vocalic energy), Peak mean.

Removed 15.52% of data as outliers based on Amplitude envelope (vocalic energy), Peak mean.

COPc integral

data = pd.read_csv(os.path.join(datafolder, "features_df_nonzscored_final.csv"))
data_c0_effort = pd.read_csv(os.path.join(datafolder, "data_c0_effort.csv"))

# merge on TrialID
data_merged = data.merge(data_c0_effort, on='TrialID', how='left')

# update concept_id
data_merged['concept_id'] = data_merged['TrialID'].str.split('_').str[0] + '_' + data_merged['concept_id']

# propagate effort_category, COP_tertile, arm_tertile, envelope_tertile to all rows of the same concept_id
data_merged[['effort_category', 'modality_specific_effort_category', 'COP_tertile', 'arm_tertile', 'envelope_tertile']] = data_merged.groupby('concept_id')[['effort_category', 'modality_specific_effort_category', 'COP_tertile', 'arm_tertile', 'envelope_tertile']].transform('first')

# COPc integral
plot_raincloud_comparison_with_grids(data_merged, var='COPc_integral', var_to_display='Change in Center of Pressure (COP) integral', grid_var='effort_category', log_transform=True, modalityout='', correctionout='c0_only')

# the same but with COP_tertile instead
plot_raincloud_comparison_with_grids(data_merged, var='COPc_integral', var_to_display='Change in Center of Pressure (COP) integral', grid_var='COP_tertile', log_transform=True, modalityout='', correctionout='c0_only')

# modality specific effort score
plot_raincloud_comparison_with_grids(data_merged, var='COPc_integral', var_to_display='Change in Center of Pressure (COP) integral', grid_var='modality_specific_effort_category', log_transform=True, modalityout='', correctionout='c0_only')
Removed 7.31% of data as outliers based on Change in Center of Pressure (COP) integral.

Removed 7.31% of data as outliers based on Change in Center of Pressure (COP) integral.

Removed 7.31% of data as outliers based on Change in Center of Pressure (COP) integral.

COPc peak mean

data = pd.read_csv(os.path.join(datafolder, "features_df_nonzscored_final.csv"))
data_c0_effort = pd.read_csv(os.path.join(datafolder, "data_c0_effort.csv"))

# merge on TrialID
data_merged = data.merge(data_c0_effort, on='TrialID', how='left')

# update concept_id
data_merged['concept_id'] = data_merged['TrialID'].str.split('_').str[0] + '_' + data_merged['concept_id']

# propagate effort_category, COP_tertile, arm_tertile, envelope_tertile to all rows of the same concept_id
data_merged[['effort_category', 'modality_specific_effort_category', 'COP_tertile', 'arm_tertile', 'envelope_tertile']] = data_merged.groupby('concept_id')[['effort_category', 'modality_specific_effort_category', 'COP_tertile', 'arm_tertile', 'envelope_tertile']].transform('first')

# COPc peak mean
plot_raincloud_comparison_with_grids(data_merged, var='COPc_peak_mean', var_to_display='Change in Center of Pressure (COP), peak mean', grid_var='effort_category', log_transform=False, modalityout='', correctionout='c0_only')

# the same but with COP_tertile instead
plot_raincloud_comparison_with_grids(data_merged, var='COPc_peak_mean', var_to_display='Change in Center of Pressure (COP), peak mean', grid_var='COP_tertile', log_transform=False, modalityout='', correctionout='c0_only')

# modality specific effort score
plot_raincloud_comparison_with_grids(data_merged, var='COPc_peak_mean', var_to_display='Change in Center of Pressure (COP), peak mean', grid_var='modality_specific_effort_category', log_transform=False, modalityout='', correctionout='c0_only')
Removed 8.59% of data as outliers based on Change in Center of Pressure (COP), peak mean.

Removed 8.59% of data as outliers based on Change in Center of Pressure (COP), peak mean.

Removed 8.59% of data as outliers based on Change in Center of Pressure (COP), peak mean.

Arm & body complexity

data = pd.read_csv(os.path.join(datafolder, "features_df_nonzscored_final.csv"))
data_c0_effort = pd.read_csv(os.path.join(datafolder, "data_c0_effort.csv"))

# merge on TrialID
data_merged = data.merge(data_c0_effort, on='TrialID', how='left')

# update concept_id
data_merged['concept_id'] = data_merged['TrialID'].str.split('_').str[0] + '_' + data_merged['concept_id']

# propagate effort_category, COP_tertile, arm_tertile, envelope_tertile to all rows of the same concept_id
data_merged[['effort_category', 'modality_specific_effort_category', 'COP_tertile', 'arm_tertile', 'envelope_tertile']] = data_merged.groupby('concept_id')[['effort_category', 'modality_specific_effort_category', 'COP_tertile', 'arm_tertile', 'envelope_tertile']].transform('first')

# Arm complexity
plot_raincloud_comparison_with_grids(data_merged, var='arm_nComp_80', var_to_display='Number of Components', grid_var='effort_category', log_transform=False, modalityout='vocal', correctionout='c0_only')
plot_raincloud_comparison_with_grids(data_merged, var='arm_slope_80', var_to_display='Slope increasing PCs', grid_var='effort_category', log_transform=False, modalityout='vocal', correctionout='c0_only')

# Arm complexity, with arm_tertile
plot_raincloud_comparison_with_grids(data_merged, var='arm_nComp_80', var_to_display='Number of Components', grid_var='arm_tertile', log_transform=False, modalityout='vocal', correctionout='c0_only')
plot_raincloud_comparison_with_grids(data_merged, var='arm_slope_80', var_to_display='Slope increasing PCs', grid_var='arm_tertile', log_transform=False, modalityout='vocal', correctionout='c0_only')

# With modality specific effort score
plot_raincloud_comparison_with_grids(data_merged, var='arm_nComp_80', var_to_display='Number of Components', grid_var='modality_specific_effort_category', log_transform=False, modalityout='vocal', correctionout='c0_only')
plot_raincloud_comparison_with_grids(data_merged, var='arm_slope_80', var_to_display='Slope increasing PCs', grid_var='modality_specific_effort_category', log_transform=False, modalityout='vocal', correctionout='c0_only')
Removed 1.27% of data as outliers based on Number of Components.

Removed 3.02% of data as outliers based on Slope increasing PCs.

Removed 1.27% of data as outliers based on Number of Components.

Removed 3.02% of data as outliers based on Slope increasing PCs.

Removed 1.27% of data as outliers based on Number of Components.

Removed 3.02% of data as outliers based on Slope increasing PCs.

data = pd.read_csv(os.path.join(datafolder, "features_df_nonzscored_final.csv"))
data_c0_effort = pd.read_csv(os.path.join(datafolder, "data_c0_effort.csv"))

# merge on TrialID
data_merged = data.merge(data_c0_effort, on='TrialID', how='left')

# update concept_id
data_merged['concept_id'] = data_merged['TrialID'].str.split('_').str[0] + '_' + data_merged['concept_id']

# propagate effort_category, COP_tertile, arm_tertile, envelope_tertile to all rows of the same concept_id
data_merged[['effort_category', 'modality_specific_effort_category', 'COP_tertile', 'arm_tertile', 'envelope_tertile']] = data_merged.groupby('concept_id')[['effort_category', 'modality_specific_effort_category', 'COP_tertile', 'arm_tertile', 'envelope_tertile']].transform('first')

# Body complexity
plot_raincloud_comparison_with_grids(data_merged, var='body_nComp_80', var_to_display='Number of Components', grid_var='effort_category', log_transform=False, modalityout='vocal', correctionout='c0_only')
plot_raincloud_comparison_with_grids(data_merged, var='body_slope_80', var_to_display='Slope increasing PCs', grid_var='effort_category', log_transform=False, modalityout='vocal', correctionout='c0_only')

# the same but with COP_tertile instead
plot_raincloud_comparison_with_grids(data_merged, var='body_nComp_80', var_to_display='Number of Components', grid_var='COP_tertile', log_transform=False, modalityout='vocal', correctionout='c0_only')
plot_raincloud_comparison_with_grids(data_merged, var='body_slope_80', var_to_display='Slope increasing PCs', grid_var='COP_tertile', log_transform=False, modalityout='vocal', correctionout='c0_only')

# With modality specific effort score
plot_raincloud_comparison_with_grids(data_merged, var='body_nComp_80', var_to_display='Number of Components', grid_var='modality_specific_effort_category', log_transform=False, modalityout='vocal', correctionout='c0_only')
plot_raincloud_comparison_with_grids(data_merged, var='body_slope_80', var_to_display='Slope increasing PCs', grid_var='modality_specific_effort_category', log_transform=False, modalityout='vocal', correctionout='c0_only')
Removed 0.04% of data as outliers based on Number of Components.

Removed 2.85% of data as outliers based on Slope increasing PCs.

Removed 0.04% of data as outliers based on Number of Components.

Removed 2.85% of data as outliers based on Slope increasing PCs.

Removed 0.04% of data as outliers based on Number of Components.

Removed 2.85% of data as outliers based on Slope increasing PCs.

BBMV

data = pd.read_csv(os.path.join(datafolder, "features_df_nonzscored_final.csv"))
data_c0_effort = pd.read_csv(os.path.join(datafolder, "data_c0_effort.csv"))

# merge on TrialID
data_merged = data.merge(data_c0_effort, on='TrialID', how='left')

# update concept_id
data_merged['concept_id'] = data_merged['TrialID'].str.split('_').str[0] + '_' + data_merged['concept_id']

# propagate effort_category, COP_tertile, arm_tertile, envelope_tertile to all rows of the same concept_id
data_merged[['effort_category', 'modality_specific_effort_category', 'COP_tertile', 'arm_tertile', 'envelope_tertile']] = data_merged.groupby('concept_id')[['effort_category', 'modality_specific_effort_category', 'COP_tertile', 'arm_tertile', 'envelope_tertile']].transform('first')

# COPc peak mean
plot_raincloud_comparison_with_grids(data_merged, var='arm_bbmv', var_to_display='BBMV', grid_var='effort_category', log_transform=False, modalityout='vocal', correctionout='c0_only')
# the same but with COP_tertile instead
plot_raincloud_comparison_with_grids(data_merged, var='arm_bbmv', var_to_display='BBMV', grid_var='arm_tertile', log_transform=False, modalityout='vocal', correctionout='c0_only')

# With modality specific effort score
plot_raincloud_comparison_with_grids(data_merged, var='arm_bbmv', var_to_display='BBMV', grid_var='modality_specific_effort_category', log_transform=False, modalityout='vocal', correctionout='c0_only')
Removed 0.44% of data as outliers based on BBMV.

Removed 0.44% of data as outliers based on BBMV.

Removed 0.44% of data as outliers based on BBMV.

Intermittency

data = pd.read_csv(os.path.join(datafolder, "features_df_nonzscored_final.csv"))
data_c0_effort = pd.read_csv(os.path.join(datafolder, "data_c0_effort.csv"))

# merge on TrialID
data_merged = data.merge(data_c0_effort, on='TrialID', how='left')

# update concept_id
data_merged['concept_id'] = data_merged['TrialID'].str.split('_').str[0] + '_' + data_merged['concept_id']

# propagate effort_category, COP_tertile, arm_tertile, envelope_tertile to all rows of the same concept_id
data_merged[['effort_category', 'modality_specific_effort_category', 'COP_tertile', 'arm_tertile', 'envelope_tertile']] = data_merged.groupby('concept_id')[['effort_category', 'modality_specific_effort_category', 'COP_tertile', 'arm_tertile', 'envelope_tertile']].transform('first')

# COPc peak mean
plot_raincloud_comparison_with_grids(data_merged, var='arm_inter_IK', var_to_display='Intermittency (based on joints)', grid_var='effort_category', log_transform=False, modalityout='vocal', correctionout='c0_only')

# the same but with COP_tertile instead
plot_raincloud_comparison_with_grids(data_merged, var='arm_inter_IK', var_to_display='Intermittency (based on joints)', grid_var='arm_tertile', log_transform=False, modalityout='vocal', correctionout='c0_only')

# With modality specific effort score
plot_raincloud_comparison_with_grids(data_merged, var='arm_inter_IK', var_to_display='Intermittency (based on joints)', grid_var='modality_specific_effort_category', log_transform=False, modalityout='vocal', correctionout='c0_only')
Removed 0.74% of data as outliers based on Intermittency (based on joints).

Removed 0.74% of data as outliers based on Intermittency (based on joints).

Removed 0.74% of data as outliers based on Intermittency (based on joints).

Exploring patterns in first trial effortfulness

data = pd.read_csv(os.path.join(datafolder, "features_df_nonzscored_final.csv"))
data_c0_effort = pd.read_csv(os.path.join(datafolder, "data_c0_effort.csv"))

# merge on TrialID
data_merged = data.merge(data_c0_effort, on='TrialID', how='left')

# update concept_id
data_merged['concept_id'] = data_merged['TrialID'].str.split('_').str[0] + '_' + data_merged['concept_id']

# propagate effort_category, COP_tertile, arm_tertile, envelope_tertile to all rows of the same concept_id
data_merged[['effort_category', 'modality_specific_effort_category', 'COP_tertile', 'arm_tertile', 'envelope_tertile']] = data_merged.groupby('concept_id')[['effort_category', 'modality_specific_effort_category', 'COP_tertile', 'arm_tertile', 'envelope_tertile']].transform('first')

Expressibility

Is there something special about high effort concepts in terms of their expressibility?

# order category by effort category (low, medium, high)
data_merged['effort_category'] = pd.Categorical(data_merged['effort_category'], categories=['Low Effort', 'Medium Effort', 'High Effort'], ordered=True)
sns.set_context("talk")  # Larger font scale
sns.set_style("whitegrid", {'axes.grid': True, 'grid.linestyle': '--'})
plt.figure(figsize=(10, 7))
pt.RainCloud(
    x='modality_specific_effort_category',
    y='expressibility',
    hue='modality',
    data=data_merged,
    palette=modality_palette,
    width_viol=0.6,
    width_box=0.15,
    move=0.15,
    bw=0.4,
    alpha=0.5,
    dodge=True,
    pointplot=True,
    orient='v'
)
plt.title('Expressibility Score by Effort Category', fontsize=16)
plt.xlabel('')
plt.ylabel('Expressibility Score', fontsize=14)
plt.xticks(fontsize=12)
plt.yticks(fontsize=12)
plt.grid(True, axis='y', linestyle='--', alpha=0.6)
#plt.legend(title='Modality', fontsize=12)
plt.tight_layout()
plt.show()
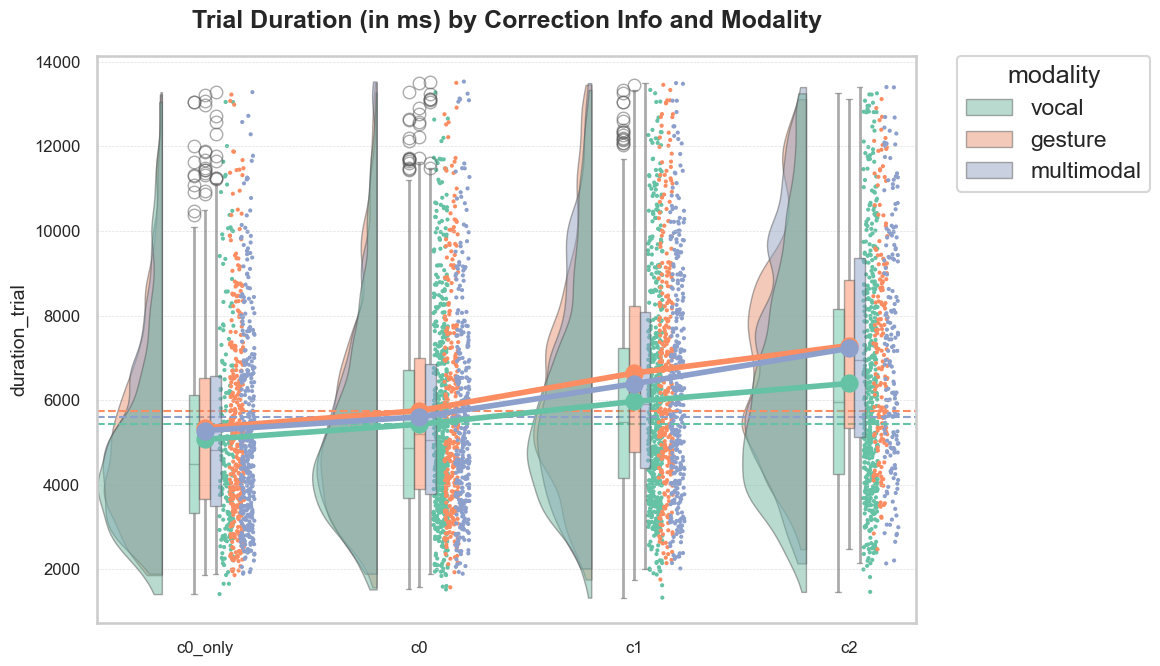
# order category by effort category (low, medium, high)
data_merged['effort_category'] = pd.Categorical(data_merged['effort_category'], categories=['Low Effort', 'Medium Effort', 'High Effort'], ordered=True)
sns.set_context("talk")  # Larger font scale
sns.set_style("whitegrid", {'axes.grid': True, 'grid.linestyle': '--'})
plt.figure(figsize=(10, 7))
pt.RainCloud(
    x='modality_specific_effort_category',
    y='expressibility',
    data=data_merged,
    width_viol=0.6,
    width_box=0.15,
    move=0.15,
    bw=0.4,
    alpha=0.5,
    dodge=True,
    pointplot=True,
    orient='v'
)
plt.title('Expressibility Score by Effort Category', fontsize=16)
plt.xlabel('')
plt.ylabel('Expressibility Score', fontsize=14)
plt.xticks(fontsize=12)
plt.yticks(fontsize=12)
plt.grid(True, axis='y', linestyle='--', alpha=0.6)
#plt.legend(title='Modality', fontsize=12)
plt.tight_layout()
plt.show()
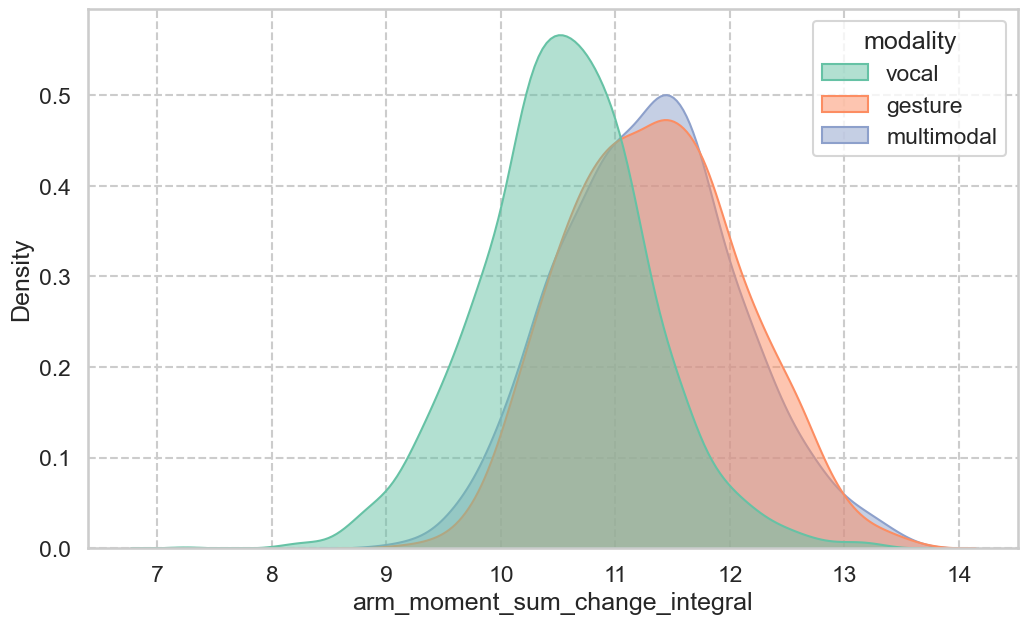
Do high effort first trials appear mainly in the beginning?

data_merged['trial_order'] = data_merged['TrialID'].str.split('_').str[2].astype(int)
data_merged['trial_bin'] = pd.cut(data_merged['trial_order'], bins=10)

effort_order = ['Low Effort', 'Medium Effort', 'High Effort']
effort_colors = ['#66c2a5', '#fc8d62', '#8da0cb']

props = (data_merged.groupby(['trial_bin', 'modality_specific_effort_category'])
                    .size()
                    .unstack(fill_value=0)
                    .reindex(columns=effort_order))
props_pct = props.div(props.sum(axis=1), axis=0)

props_pct.plot(kind='bar', stacked=True, color=effort_colors, figsize=(12, 5), width=0.85)
plt.title('Effort Category Proportion by Trial Order', fontsize=16)
plt.xlabel('Trial Order (binned)', fontsize=13)
plt.ylabel('Proportion', fontsize=13)
plt.xticks(rotation=30, ha='right')
plt.legend(title='Effort Category', bbox_to_anchor=(1.01, 1), loc='upper left')
plt.grid(True, axis='y', linestyle='--', alpha=0.6)
plt.tight_layout()
plt.show()
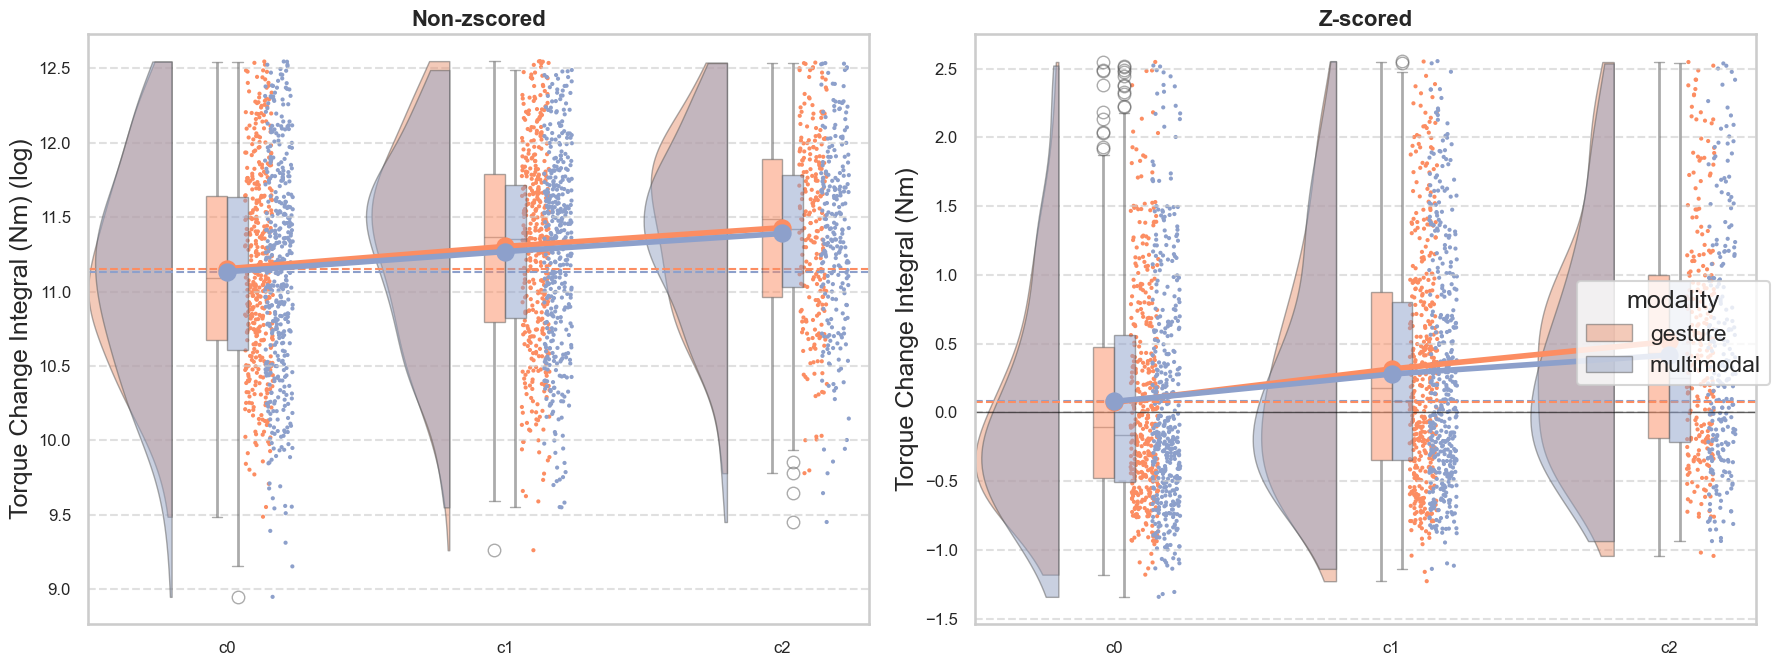
Do participants vary along these three categories?

effort_order = ['Low Effort', 'Medium Effort', 'High Effort']
effort_colors = ['#66c2a5', '#fc8d62', '#8da0cb']

data_merged['pcn_ID'] = data_merged['TrialID'].str.split('_').str[0] + '_' + data_merged['TrialID'].str.split('_').str[-1]
props = (data_merged.groupby(['pcn_ID', 'modality_specific_effort_category'])
                    .size()
                    .unstack(fill_value=0)
                    .reindex(columns=effort_order))
props_pct = props.div(props.sum(axis=1), axis=0)


props_pct.plot(kind='bar', stacked=True, color=effort_colors, figsize=(30, 5), width=0.9)
plt.title('Effort Category Proportion by Trial Order', fontsize=16)
plt.xlabel('Participant ID', fontsize=5)
plt.ylabel('Proportion', fontsize=13)
plt.xticks(rotation=90, ha='right')
plt.legend(title='Effort Category', bbox_to_anchor=(1.01, 1), loc='upper left')
plt.grid(True, axis='y', linestyle='--', alpha=0.6)
plt.tight_layout()
plt.show()
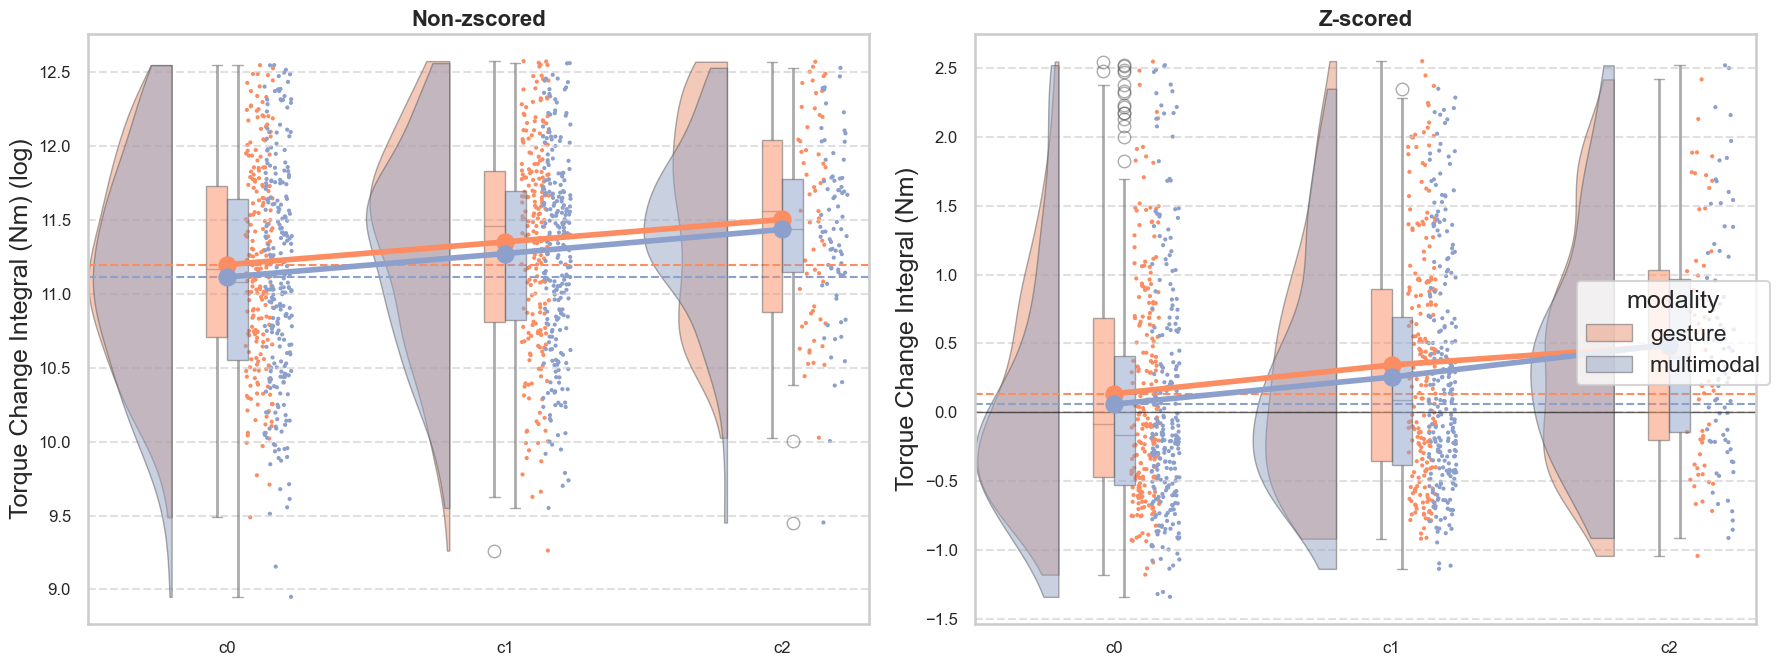
It seems that participants are either high-medium, or low-medium, rarely (but sometimes) producing first trials belonging to all three categories

Do concepts systematically vary along these three categories?

effort_order = ['Low Effort', 'Medium Effort', 'High Effort']
effort_colors = ['#66c2a5', '#fc8d62', '#8da0cb']

props = (data_merged.groupby(['concept', 'modality_specific_effort_category'])
                    .size()
                    .unstack(fill_value=0)
                    .reindex(columns=effort_order))
props_pct = props.div(props.sum(axis=1), axis=0)


props_pct.plot(kind='bar', stacked=True, color=effort_colors, figsize=(30, 5), width=0.9)
plt.title('Effort Category Proportion by Trial Order', fontsize=16)
plt.xlabel('Concept', fontsize=5)
plt.ylabel('Proportion', fontsize=13)
plt.xticks(rotation=90, ha='right')
plt.legend(title='Effort Category', bbox_to_anchor=(1.01, 1), loc='upper left')
plt.grid(True, axis='y', linestyle='--', alpha=0.6)
plt.tight_layout()
plt.show()
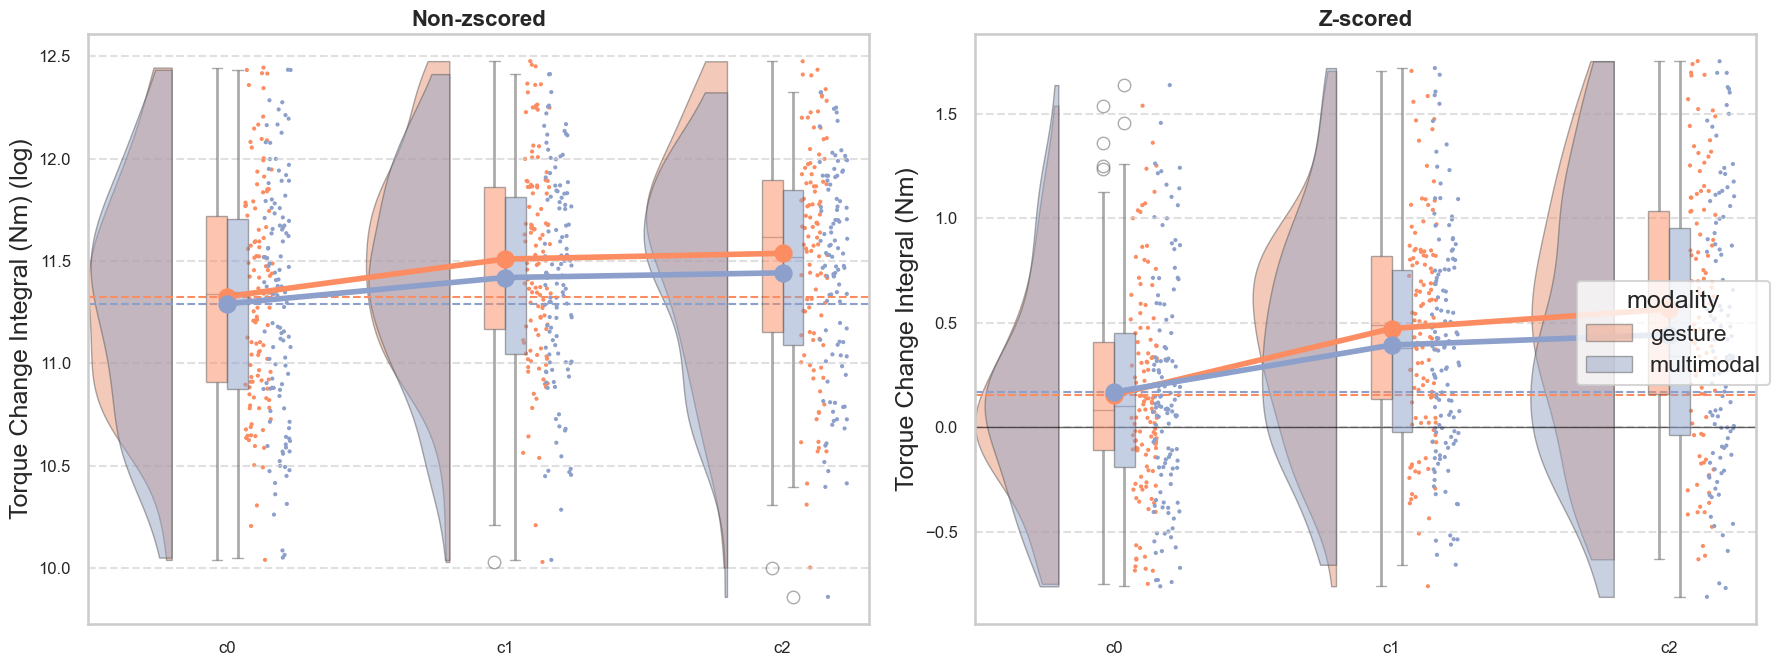
Does guessing unfold differently in low, medium, high effort first trials?

data = pd.read_csv(os.path.join(datafolder, "features_df_nonzscored_final.csv"))
data_c0_effort = pd.read_csv(os.path.join(datafolder, "data_c0_effort.csv"))

# merge on TrialID
data_merged = data.merge(data_c0_effort, on='TrialID', how='left')

# update concept_id
data_merged['concept_id'] = data_merged['TrialID'].str.split('_').str[0] + '_' + data_merged['concept_id']

# propagate effort_category, COP_tertile, arm_tertile, envelope_tertile to all rows of the same concept_id
data_merged[['effort_category', 'modality_specific_effort_category', 'COP_tertile', 'arm_tertile', 'envelope_tertile']] = data_merged.groupby('concept_id')[['effort_category', 'modality_specific_effort_category', 'COP_tertile', 'arm_tertile', 'envelope_tertile']].transform('first')

# COPc peak mean
plot_raincloud_comparison_with_grids(data_merged, var='answer_fol_dist', var_to_display='Cosine similarity of the following answer', grid_var='modality_specific_effort_category', log_transform=False, modalityout='', correctionout='c0_only')
Removed 0.00% of data as outliers based on Cosine similarity of the following answer.

It seeems that gesture in high and medium effort is the most resistant against total miscommunication. At the same time, multimodal seems to be between c0-c1 unaffected by the initial effort

What happens if we look only at the succesfull trials?

data = pd.read_csv(os.path.join(datafolder, "features_df_nonzscored_final.csv")) 
data_c0_effort = pd.read_csv(os.path.join(datafolder, "data_c0_effort.csv")) 

# merge on TrialID 
data_merged = data.merge(data_c0_effort, on='TrialID', how='left') 
# update concept_id 
data_merged['concept_id'] = data_merged['TrialID'].str.split('_').str[0] + '_' + data_merged['concept_id'] 
# propagate effort_category, COP_tertile, arm_tertile, envelope_tertile to all rows of the same concept_id 
data_merged[['effort_category', 'modality_specific_effort_category', 'COP_tertile', 'arm_tertile', 'envelope_tertile']] = data_merged.groupby('concept_id')[['effort_category', 'modality_specific_effort_category', 'COP_tertile', 'arm_tertile', 'envelope_tertile']].transform('first') 

# for eacg concept_id, check if the last correction available (c0, c1, c2) has answer_fol_dist 1, if yes, put in the column overal_success 1, else 0 
def check_overall_success(group): 
    # order the correction_info by the desired order 
    correction_order = ['c0', 'c1', 'c2'] 
    group = group.sort_values('correction_info', key=lambda x: x.map({c: i for i, c in enumerate(correction_order)})) 
    last_correction = group['correction_info'].iloc[-1] # check if answer_fol_dist is 1 in the last correction 
    if group[group['correction_info'] == last_correction]['answer_fol_dist'].iloc[0] == 1: # put 1 to all rows of the group in overall_success 
        return 1
    else: 
        return 0 
    
for concept_id, group in data_merged.groupby('concept_id'): 
    overall_success = check_overall_success(group) 
    data_merged.loc[group.index, 'overall_success'] = overall_success 
        
        
data_success_only = data_merged[data_merged['overall_success'] == 1]
# COPc peak mean 
plot_raincloud_comparison_with_grids(data_success_only, var='answer_fol_dist', var_to_display='Cosine similarity of the following answer', grid_var='modality_specific_effort_category', log_transform=False, modalityout='', correctionout='c0_only')
Removed 0.00% of data as outliers based on Cosine similarity of the following answer.

Not sure why is there the vertical line, probably because of few data

And it we look at only the unsuccesfull ones

data = pd.read_csv(os.path.join(datafolder, "features_df_nonzscored_final.csv")) 
data_c0_effort = pd.read_csv(os.path.join(datafolder, "data_c0_effort.csv")) 

# merge on TrialID 
data_merged = data.merge(data_c0_effort, on='TrialID', how='left') 
# update concept_id 
data_merged['concept_id'] = data_merged['TrialID'].str.split('_').str[0] + '_' + data_merged['concept_id'] 
# propagate effort_category, COP_tertile, arm_tertile, envelope_tertile to all rows of the same concept_id 
data_merged[['effort_category', 'modality_specific_effort_category', 'COP_tertile', 'arm_tertile', 'envelope_tertile']] = data_merged.groupby('concept_id')[['effort_category', 'modality_specific_effort_category', 'COP_tertile', 'arm_tertile', 'envelope_tertile']].transform('first') 

# for eacg concept_id, check if the last correction available (c0, c1, c2) has answer_fol_dist 1, if yes, put in the column overal_success 1, else 0 
def check_overall_success(group): 
    # order the correction_info by the desired order 
    correction_order = ['c0', 'c1', 'c2'] 
    group = group.sort_values('correction_info', key=lambda x: x.map({c: i for i, c in enumerate(correction_order)})) 
    last_correction = group['correction_info'].iloc[-1] # check if answer_fol_dist is 1 in the last correction 
    if group[group['correction_info'] == last_correction]['answer_fol_dist'].iloc[0] == 1: # put 1 to all rows of the group in overall_success 
        return 1
    else: 
        return 0 
    
for concept_id, group in data_merged.groupby('concept_id'): 
    overall_success = check_overall_success(group) 
    data_merged.loc[group.index, 'overall_success'] = overall_success 
        
        
data_unsuccess_only = data_merged[data_merged['overall_success'] == 0]
# COPc peak mean 
plot_raincloud_comparison_with_grids(data_unsuccess_only, var='answer_fol_dist', var_to_display='Cosine similarity of the following answer', grid_var='modality_specific_effort_category', log_transform=False, modalityout='', correctionout='c0_only')
Removed 2.97% of data as outliers based on Cosine similarity of the following answer.

How does duration look like

data = pd.read_csv(os.path.join(datafolder, "features_df_nonzscored_final.csv"))
data_c0_effort = pd.read_csv(os.path.join(datafolder, "data_c0_effort.csv"))

# merge on TrialID
data_merged = data.merge(data_c0_effort, on='TrialID', how='left')

# update concept_id
data_merged['concept_id'] = data_merged['TrialID'].str.split('_').str[0] + '_' + data_merged['concept_id']

# propagate effort_category, COP_tertile, arm_tertile, envelope_tertile to all rows of the same concept_id
data_merged[['effort_category', 'modality_specific_effort_category', 'COP_tertile', 'arm_tertile', 'envelope_tertile']] = data_merged.groupby('concept_id')[['effort_category', 'modality_specific_effort_category', 'COP_tertile', 'arm_tertile', 'envelope_tertile']].transform('first')

# COPc peak mean
plot_raincloud_comparison_with_grids(data_merged, var='duration_trial', var_to_display='Trial Duration', grid_var='modality_specific_effort_category', log_transform=False, modalityout='', correctionout='c0_only')
Removed 4.76% of data as outliers based on Trial Duration.

Relation to previous answer similarity

Duration

features_df = pd.read_csv(os.path.join(datafolder, "features_df_nonzscored_final.csv"))

plot_relationship(features_df, 
                  x_var='answer_prev_dist', 
                  y_var='duration_trial')

Torque integral

features_df = pd.read_csv(os.path.join(datafolder, "features_df_nonzscored_final.csv"))

plot_relationship(features_df, 
                  x_var='answer_prev_dist', 
                  y_var='arm_moment_sum_change_integral', 
                  modalityout='vocal')

With effort category (first trial)

# plot relationship between arm_moment_sum_change_integral and answer_prev_dist with a regression line seprately for each first trial effort modality
data = pd.read_csv(os.path.join(datafolder, "features_df_nonzscored_final.csv"))
data_c0_effort = pd.read_csv(os.path.join(datafolder, "data_c0_effort.csv"))

# merge on TrialID
data_merged = data.merge(data_c0_effort, on='TrialID', how='left')

# update concept_id
data_merged['concept_id'] = data_merged['TrialID'].str.split('_').str[0] + '_' + data_merged['concept_id']

data_merged[['effort_category', 'COP_tertile', 'arm_tertile', 'envelope_tertile']] = data_merged.groupby('concept_id')[['effort_category', 'COP_tertile', 'arm_tertile', 'envelope_tertile']].transform('first')

effort_palette = {'Low Effort': '#66c2a5', 'Medium Effort': '#fc8d62', 'High Effort': '#8da0cb'}

# log transform arm_moment_sum_change_integral
data_merged['arm_moment_sum_change_integral_log'] = np.log1p(data_merged['arm_moment_sum_change_integral'])

# get rid of modality vocal
data_merged = data_merged[data_merged['modality'] != 'vocal']
# and get rid of correction_info c0_only
data_merged = data_merged[data_merged['correction_info'] != 'c0_only']

# plot relationship between arm_moment_sum_change_integral and answer_prev_dist with a regression line seprately for each first trial effort modality
sns.set_context("talk")  # Larger font scale
sns.set_style("whitegrid", {'axes.grid': True, 'grid.linestyle': '--'})
plt.figure(figsize=(10, 7))
sns.lmplot(
    x='answer_prev_dist',
    y='arm_moment_sum_change_integral_log',
    hue='effort_category',
    data=data_merged,
    palette=effort_palette,
    aspect=1.5,
    height=6,
    scatter_kws={'alpha': 0.5},
    legend=False
)
plt.title('Relationship between Arm Torque Change Integral and Distance to Previous Answer, by Effort Category', fontsize=16)
plt.xlabel('Distance to Previous Answer', fontsize=14)  
plt.ylabel('Arm Torque Change Integral (Nm)', fontsize=14)
plt.xticks(fontsize=12)
plt.yticks(fontsize=12)
plt.grid(True, axis='y', linestyle='--', alpha=0.6)
plt.legend(title='Effort Category', fontsize=12)
plt.tight_layout()
plt.show()
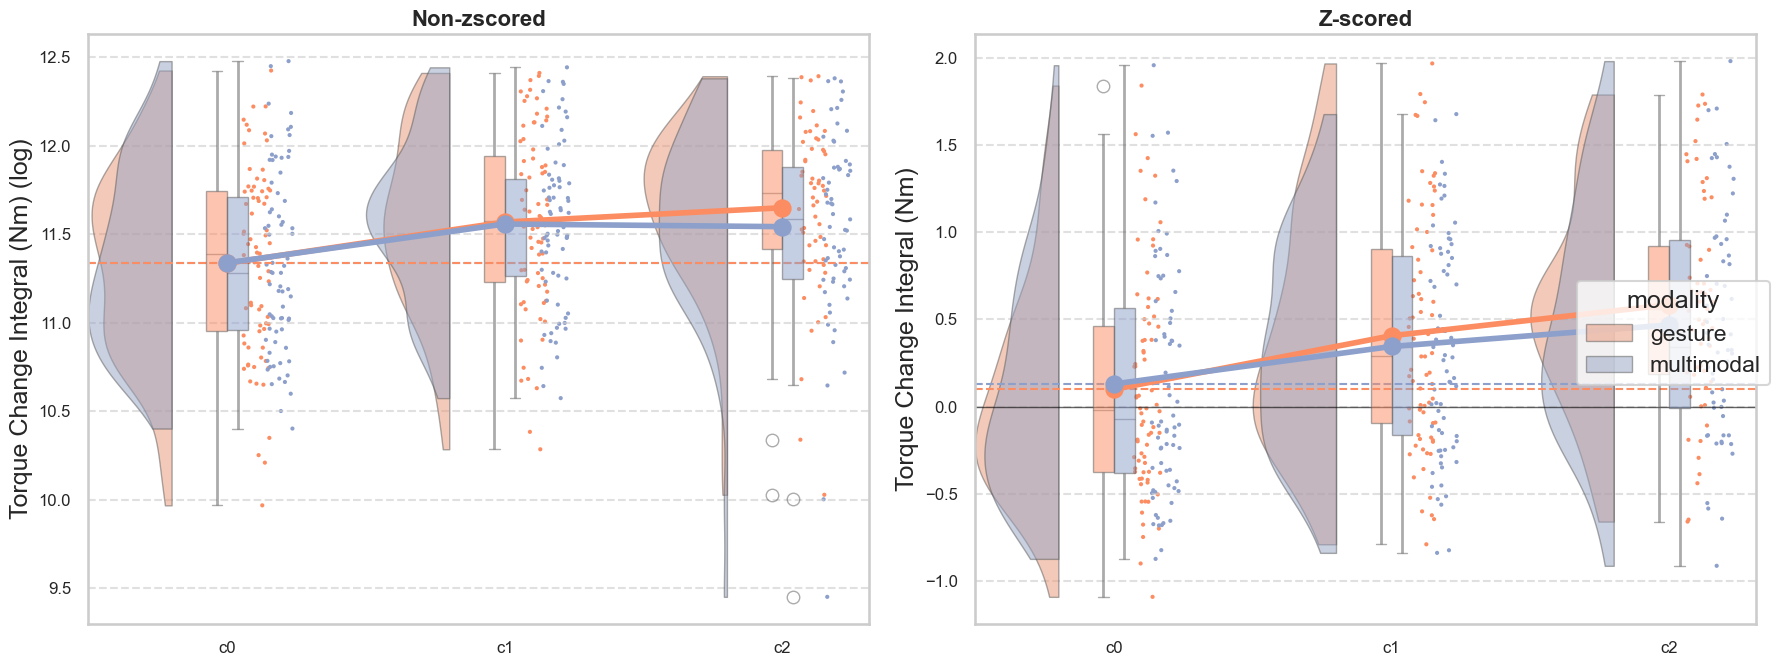
<Figure size 1000x700 with 0 Axes>

With effort category (participant’s effort)

# the same but now with bins for participant's effort
data = pd.read_csv(os.path.join(datafolder, "features_df_nonzscored_final.csv"))
# create pcn_ID which is the first and last element of TrialID separated by _
data['pcn_ID'] = data['TrialID'].str.split('_').str[0] + '_' + data['TrialID'].str.split('_').str[-1]
data_pcn_effort = pd.read_csv(os.path.join(datafolder, "participants_effort_df.csv"))

# merge on TrialID
data_merged = data.merge(data_pcn_effort, on='pcn_ID', how='left')

# update concept_id
data_merged['concept_id'] = data_merged['TrialID'].str.split('_').str[0] + '_' + data_merged['concept_id']

data_merged[['effort_category', 'COP_tertile', 'arm_tertile', 'envelope_tertile']] = data_merged.groupby('concept_id')[['effort_category', 'COP_tertile', 'arm_tertile', 'envelope_tertile']].transform('first')

effort_palette = {'Low Effort': '#66c2a5', 'Medium Effort': '#fc8d62', 'High Effort': '#8da0cb'}

# log transform arm_moment_sum_change_integral
data_merged['arm_moment_sum_change_integral_log'] = np.log1p(data_merged['arm_moment_sum_change_integral'])

# get rid of modality vocal
data_merged = data_merged[data_merged['modality'] != 'vocal']
# and get rid of correction_info c0_only
data_merged = data_merged[data_merged['correction_info'] != 'c0_only']

# plot relationship between arm_moment_sum_change_integral and answer_prev_dist with a regression line seprately for each first trial effort modality
sns.set_context("talk")  # Larger font scale
sns.set_style("whitegrid", {'axes.grid': True, 'grid.linestyle': '--'})
plt.figure(figsize=(10, 7))
sns.lmplot(
    x='answer_prev_dist',
    y='arm_moment_sum_change_integral_log',
    hue='effort_category',
    data=data_merged,
    palette=effort_palette,
    aspect=1.5,
    height=6,
    scatter_kws={'alpha': 0.5},
    legend=False
)
plt.title('Relationship between Arm Torque Change Integral and Distance to Previous Answer, by Effort Category', fontsize=16)
plt.xlabel('Distance to Previous Answer', fontsize=14)  
plt.ylabel('Arm Torque Change Integral (Nm)', fontsize=14)
plt.xticks(fontsize=12)
plt.yticks(fontsize=12)
plt.grid(True, axis='y', linestyle='--', alpha=0.6)
plt.legend(title='Effort Category', fontsize=12)
plt.tight_layout()
plt.show()
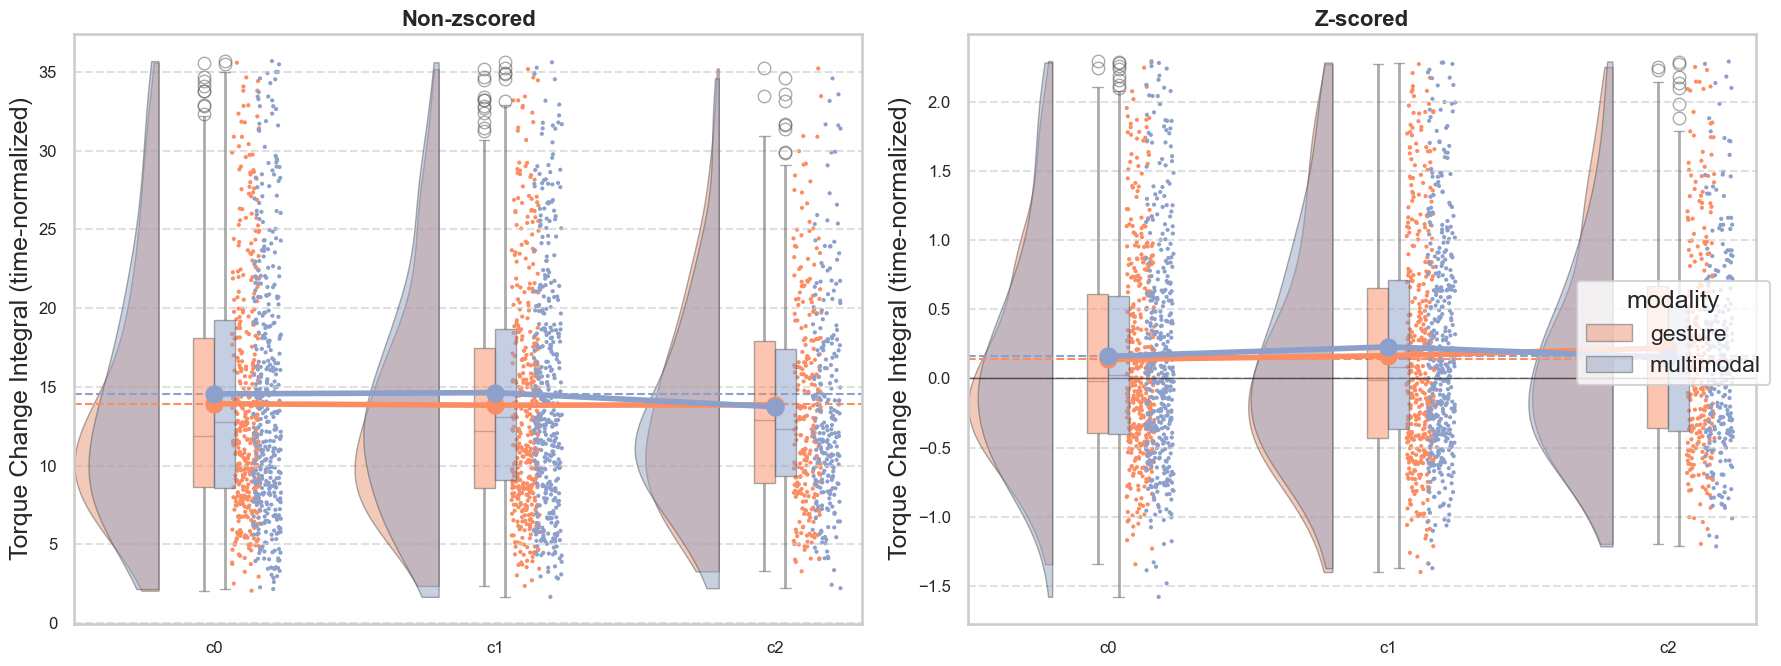
<Figure size 1000x700 with 0 Axes>

With binned similarity

features_df = pd.read_csv(os.path.join(datafolder, "features_df_nonzscored_final.csv"))

# bin answer_prev_dist into 3 bins by quantiles
features_df['answer_prev_dist_bin'] = pd.qcut(features_df['answer_prev_dist'], q=3, labels=['Low', 'Medium', 'High'])

# get rid of modality vocal
features_df = features_df[features_df['modality'] != 'vocal']

# log transform arm_moment_sum_change_integral
features_df['arm_moment_sum_change_integral_log'] = np.log1p(features_df['arm_moment_sum_change_integral'])

# plot raincloud of arm_moment_sum_change_integral for each answer_prev_dist_bin
sns.set_context("talk")  # Larger font scale
sns.set_style("whitegrid", {'axes.grid': True, 'grid.linestyle': '--'})
plt.figure(figsize=(10, 7))
pt.RainCloud(
    x='answer_prev_dist_bin',
    y='arm_moment_sum_change_integral_log',
    data=features_df,
    palette=['#66c2a5', '#fc8d62', '#8da0cb'],
    width_viol=0.6,
    width_box=0.15,
    move=0.15,
    bw=0.4,
    alpha=0.5,
    dodge=True,
    pointplot=True,
    orient='v'
)

With binned similarity of first trial

features_df = pd.read_csv(os.path.join(datafolder, "features_df_nonzscored_final.csv"))

# bin each trial of correction_info=c0 into 3 bins: below 0.4 is low, 0.4-0.65 is medium, above 0.65 is high
features_df['answer_fol_dist_first_bin'] = pd.cut(features_df[features_df['correction_info'] == 'c0']['answer_fol_dist'], bins=[0, 0.4, 1], labels=['Low', 'High'], include_lowest=True)

# propagate the first bin to all rows with the same concept_id
features_df['answer_fol_dist_first_bin'] = features_df.groupby('concept_id')['answer_fol_dist_first_bin'].transform('first')


# log transform arm_moment_sum_change_integral
features_df['arm_moment_sum_change_integral_log'] = np.log1p(features_df['arm_moment_sum_change_integral'])

# get rid of modality vocal
features_df = features_df[features_df['modality'] != 'vocal']
# and get rid of correction_info c0_only
features_df = features_df[features_df['correction_info'] != 'c0_only']

# plot relationship between arm_moment_sum_change_integral and answer_prev_dist with a regression line seprately for each first trial effort modality
sns.set_context("talk")  # Larger font scale
sns.set_style("whitegrid", {'axes.grid': True, 'grid.linestyle': '--'})
plt.figure(figsize=(10, 7))
sns.lmplot(
    x='answer_prev_dist',
    y='arm_moment_sum_change_integral_log',
    hue='answer_fol_dist_first_bin',
    data=features_df,
    aspect=1.5,
    height=6,
    scatter_kws={'alpha': 0.5},
    legend=False
)
plt.title('Relationship between Arm Torque Change Integral and Distance to Previous Answer, by First Trial Success', fontsize=16)
plt.xlabel('Distance to Previous Answer', fontsize=14)  
plt.ylabel('Arm Torque Change Integral (Nm)', fontsize=14)
plt.xticks(fontsize=12)
plt.yticks(fontsize=12)
plt.grid(True, axis='y', linestyle='--', alpha=0.6)
plt.legend(title='First Trial Success', fontsize=12)
plt.tight_layout()
plt.show()
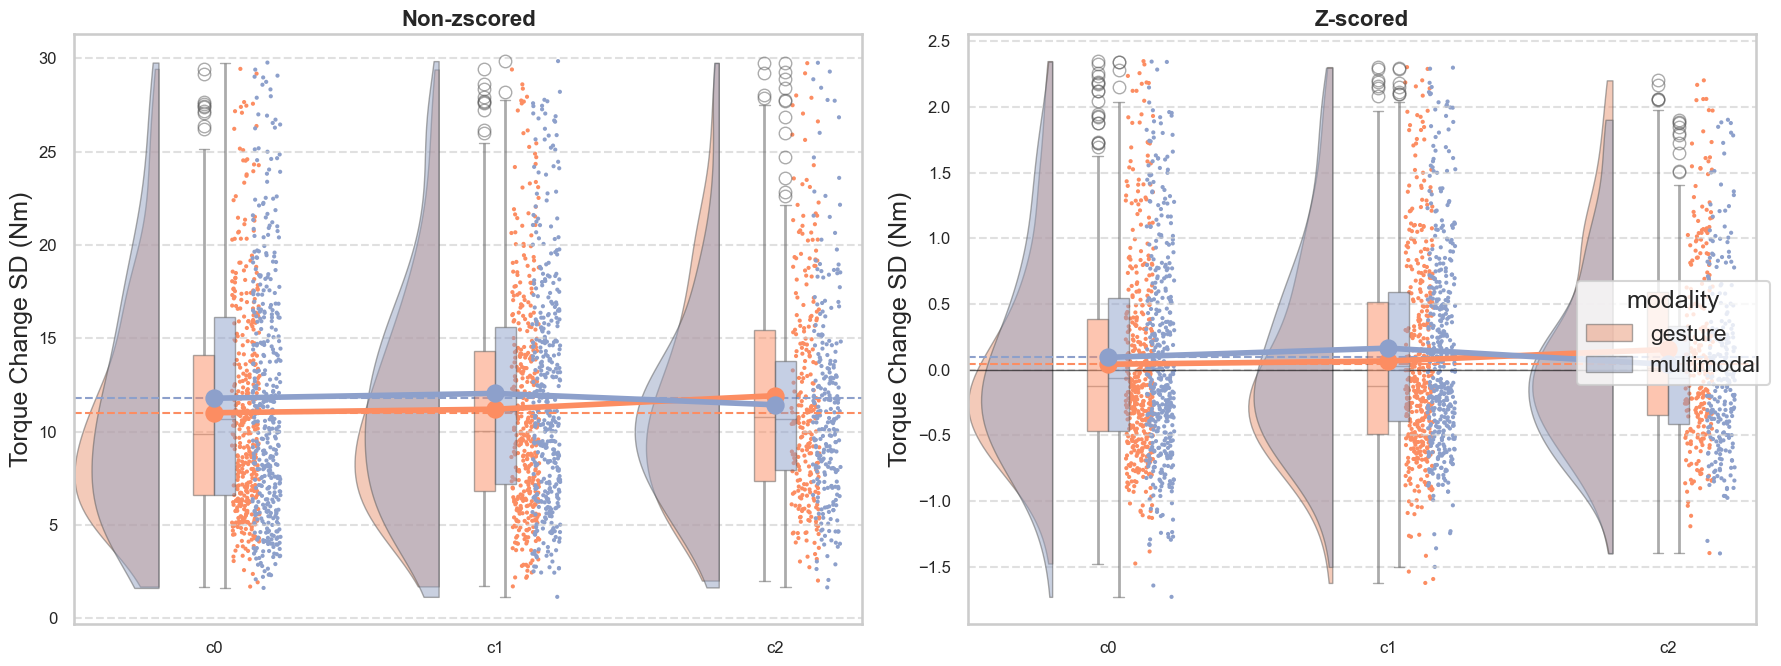
<Figure size 1000x700 with 0 Axes>

Torque pospeak mean

features_df = pd.read_csv(os.path.join(datafolder, "features_df_nonzscored_final.csv"))
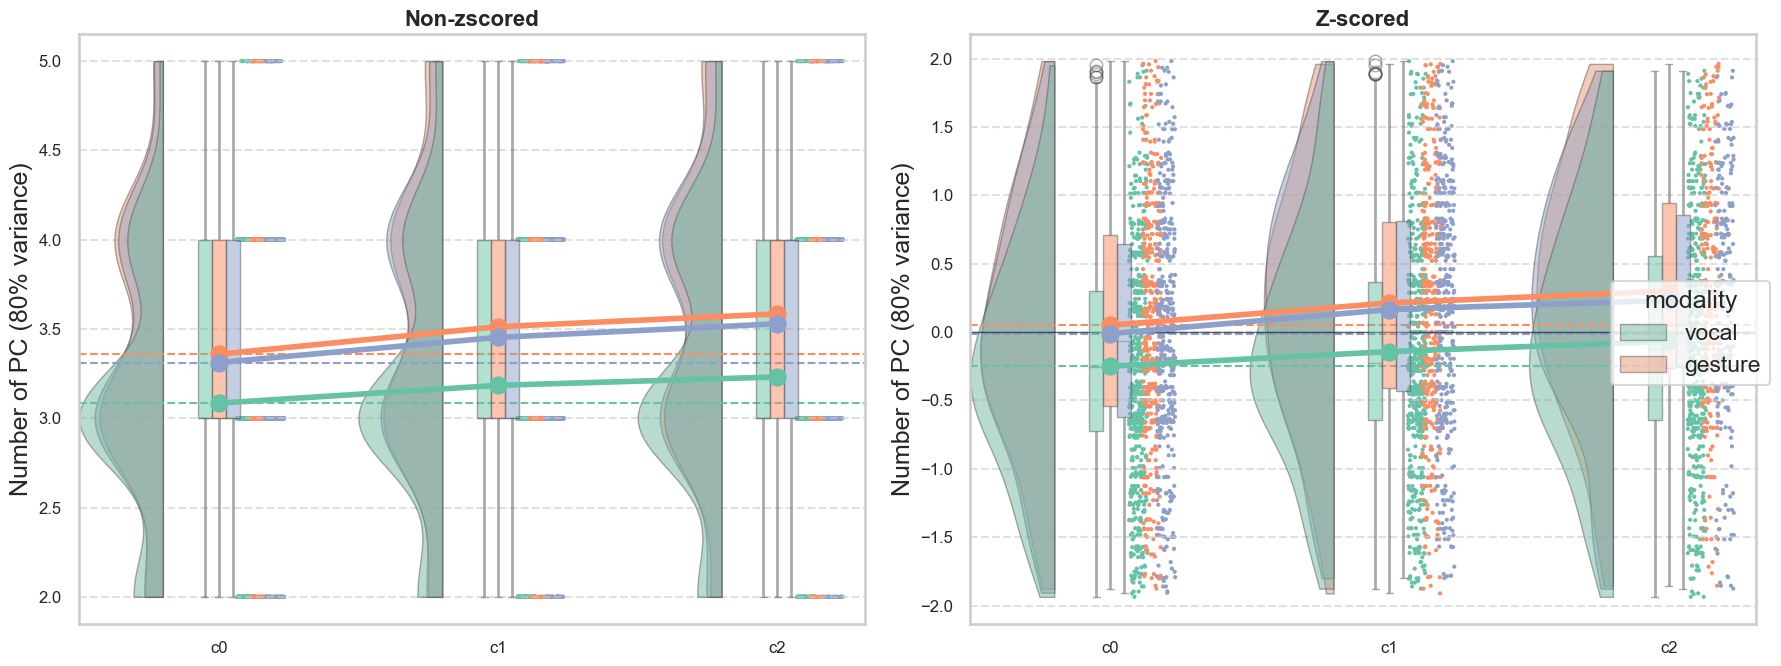
plot_relationship(features_df, 
                  x_var='answer_prev_dist', 
                  y_var='arm_moment_sum_change_peak_mean', 
                  modalityout='vocal')
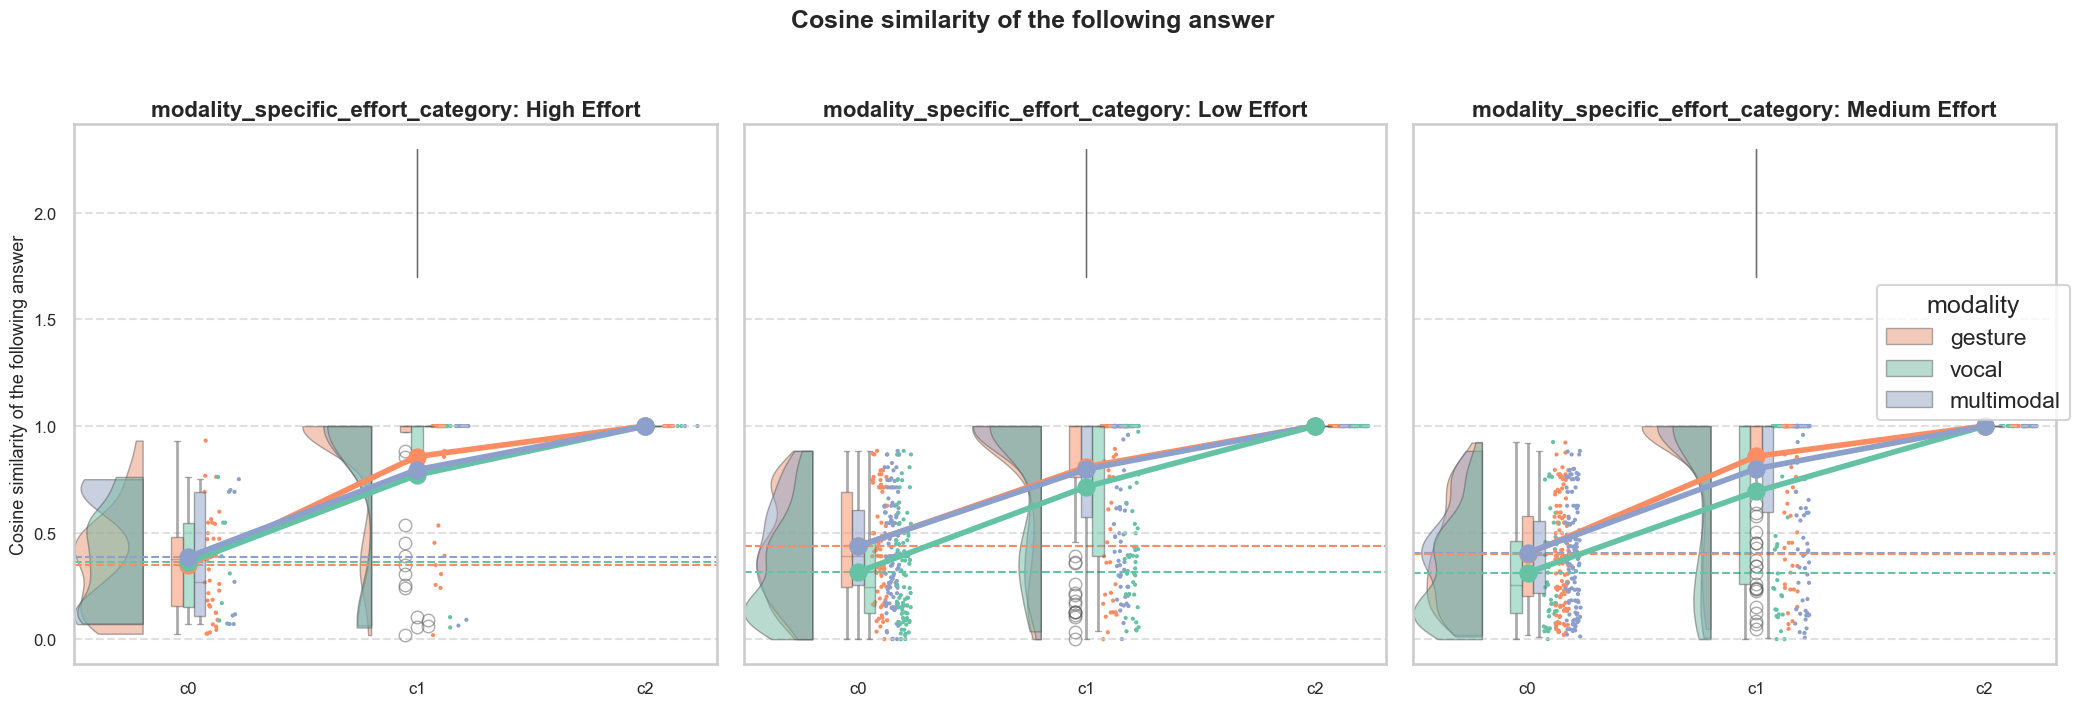
Envelope integral

features_df = pd.read_csv(os.path.join(datafolder, "features_df_nonzscored_final.csv"))

plot_relationship(features_df, 
                  x_var='answer_prev_dist', 
                  y_var='envelope_norm_integral', 
                  modalityout='gesture')

Envelope pospeak mean

features_df = pd.read_csv(os.path.join(datafolder, "features_df_nonzscored_final.csv"))

plot_relationship(features_df, 
                  x_var='answer_prev_dist', 
                  y_var='envelope_norm_peak_mean', 
                  modalityout='gesture')

COPc integral

features_df = pd.read_csv(os.path.join(datafolder, "features_df_nonzscored_final.csv"))

plot_relationship(features_df, 
                  x_var='answer_prev_dist', 
                  y_var='COPc_integral', 
                  modalityout='')

COPc pospeak mean

features_df = pd.read_csv(os.path.join(datafolder, "features_df_nonzscored_final.csv"))

plot_relationship(features_df, 
                  x_var='answer_prev_dist', 
                  y_var='COPc_peak_mean',
                  modalityout='')

Trial order

features_df = pd.read_csv(os.path.join(datafolder, "features_df_nonzscored_final.csv"))

# create trial_order column that is the third element of TrialID
features_df['trial_order'] = features_df['TrialID'].str.split('_').str[2].astype(int)

# plot relationship between trial order and arm torque integral
plot_relationship(features_df, 'trial_order', 'arm_moment_sum_change_integral', modalityout='vocal')

# trial order - envelope integral
plot_relationship(features_df, 'trial_order', 'envelope_norm_integral', modalityout='gesture')

# trial order - copc integral
plot_relationship(features_df, 'trial_order', 'COPc_integral', modalityout='')

Expressibility

features_df_nonz = pd.read_csv(os.path.join(datafolder, "features_df_nonzscored_final.csv"))

plot_relationship(features_df_nonz, 
                  x_var='expressibility', 
                  y_var='arm_moment_sum_change_integral', 
                  modalityout='vocal')

features_df_nonz = pd.read_csv(os.path.join(datafolder, "features_df_nonzscored_final.csv"))

plot_relationship(features_df_nonz, 
                  x_var='expressibility', 
                  y_var='arm_moment_sum_change_peak_mean', 
                  modalityout='vocal')

features_df_nonz = pd.read_csv(os.path.join(datafolder, "features_df_nonzscored_final.csv"))

plot_relationship(features_df_nonz, 
                  x_var='expressibility', 
                  y_var='COPc_integral', 
                  modalityout='')

features_df_nonz = pd.read_csv(os.path.join(datafolder, "features_df_nonzscored_final.csv"))

plot_relationship(features_df_nonz, 
                  x_var='expressibility', 
                  y_var='COPc_peak_mean', 
                  modalityout='')

features_df_nonz = pd.read_csv(os.path.join(datafolder, "features_df_nonzscored_final.csv"))

plot_relationship(features_df_nonz, 
                  x_var='expressibility', 
                  y_var='envelope_norm_integral', 
                  modalityout='gesture')

features_df_nonz = pd.read_csv(os.path.join(datafolder, "features_df_nonzscored_final.csv"))

plot_relationship(features_df_nonz, 
                  x_var='expressibility', 
                  y_var='envelope_norm_peak_mean', 
                  modalityout='gesture')

Metadata

Familiarity & duration

data = pd.read_csv(os.path.join(datafolder, "features_df_nonzscored_final_with_demo.csv"))

plot_relationship(data, 
                  x_var='Familiarity', 
                  y_var='duration_trial', 
                  modalityout='')

Familarity & effort variables

# torque integral
data = pd.read_csv(os.path.join(datafolder, "features_df_nonzscored_final_with_demo.csv"))

plot_relationship(data, 
                  x_var='Familiarity', 
                  y_var='arm_moment_sum_change_integral', 
                  modalityout='vocal')

# torque peak mean
data = pd.read_csv(os.path.join(datafolder, "features_df_nonzscored_final_with_demo.csv"))

plot_relationship(data, 
                  x_var='Familiarity', 
                  y_var='arm_moment_sum_change_peak_mean', 
                  modalityout='vocal')

# COP integral
data = pd.read_csv(os.path.join(datafolder, "features_df_nonzscored_final_with_demo.csv"))

plot_relationship(data, 
                  x_var='Familiarity', 
                  y_var='COPc_integral', 
                  modalityout='')

# COPc peak mean
data = pd.read_csv(os.path.join(datafolder, "features_df_nonzscored_final_with_demo.csv"))

plot_relationship(data, 
                  x_var='Familiarity', 
                  y_var='COPc_peak_mean', 
                  modalityout='')

# envelope integral
data = pd.read_csv(os.path.join(datafolder, "features_df_nonzscored_final_with_demo.csv"))

plot_relationship(data, 
                  x_var='Familiarity', 
                  y_var='envelope_norm_integral', 
                  modalityout='gesture')

# envelope peak mean
data = pd.read_csv(os.path.join(datafolder, "features_df_nonzscored_final_with_demo.csv"))

plot_relationship(data, 
                  x_var='Familiarity', 
                  y_var='envelope_norm_peak_mean', 
                  modalityout='gesture')

BFI

BFI all

data = pd.read_csv(os.path.join(datafolder, "features_df_nonzscored_final_with_demo.csv"))

# log the torque integral
data['arm_moment_sum_change_integral_log'] = np.log(data['arm_moment_sum_change_integral'] + 1)  # add 1 to avoid log(0)

# get rid of vocal modality
data = data[data['modality'] != 'vocal']

bfi_traits = ['BFI_extra', 'BFI_agree', 'BFI_consc', 'BFI_negemo', 'BFI_open']
num_traits = len(bfi_traits)
num_cols = 3
num_rows = (num_traits + num_cols - 1) // num_cols
sns.set_context("talk")  # Larger font scale
sns.set_style("whitegrid", {'axes.grid': True, 'grid.linestyle': '--'})
plt.figure(figsize=(20, num_rows * 7))
for i, trait in enumerate(bfi_traits):
    plt.subplot(num_rows, num_cols, i + 1)
    sns.scatterplot(
        data=data,
        x=trait,
        y='arm_moment_sum_change_integral_log',
        hue='modality',
        palette=modality_palette,
        alpha=0.7
    )
    # add regression line
    sns.regplot(
        data=data,
        x=trait,
        y='arm_moment_sum_change_integral_log',
        scatter=False,
        color='black',
        line_kws={'linewidth': 2}
    )
    plt.title(f'Torque Change Integral vs {trait}', fontsize=16)
    plt.xlabel(trait, fontsize=14)
    plt.ylabel('Torque Change Integral (Nm)', fontsize=14)

data = pd.read_csv(os.path.join(datafolder, "features_df_nonzscored_final_with_demo.csv"))

# log the torque integral
data['COPc_integral_log'] = np.log(data['COPc_integral'] + 1)  # add 1 to avoid log(0)

bfi_traits = ['BFI_extra', 'BFI_agree', 'BFI_consc', 'BFI_negemo', 'BFI_open']
num_traits = len(bfi_traits)
num_cols = 3
num_rows = (num_traits + num_cols - 1) // num_cols
sns.set_context("talk")  # Larger font scale
sns.set_style("whitegrid", {'axes.grid': True, 'grid.linestyle': '--'})
plt.figure(figsize=(20, num_rows * 7))
for i, trait in enumerate(bfi_traits):
    plt.subplot(num_rows, num_cols, i + 1)
    sns.scatterplot(
        data=data,
        x=trait,
        y='COPc_integral_log',
        hue='modality',
        palette=modality_palette,
        alpha=0.7
    )
    # add regression line
    sns.regplot(
        data=data,
        x=trait,
        y='COPc_integral_log',
        scatter=False,
        color='black',
        line_kws={'linewidth': 2}
    )
    plt.title(f'COP Change Integral vs {trait}', fontsize=16)
    plt.xlabel(trait, fontsize=14)
    plt.ylabel('COP Change Integral (Nm)', fontsize=14)

data = pd.read_csv(os.path.join(datafolder, "features_df_nonzscored_final_with_demo.csv"))

# log the torque integral
data['envelope_norm_integral_log'] = np.log(data['envelope_norm_integral'] + 1)  # add 1 to avoid log(0)

bfi_traits = ['BFI_extra', 'BFI_agree', 'BFI_consc', 'BFI_negemo', 'BFI_open']
num_traits = len(bfi_traits)
num_cols = 3
num_rows = (num_traits + num_cols - 1) // num_cols
sns.set_context("talk")  # Larger font scale
sns.set_style("whitegrid", {'axes.grid': True, 'grid.linestyle': '--'})
plt.figure(figsize=(20, num_rows * 7))
for i, trait in enumerate(bfi_traits):
    plt.subplot(num_rows, num_cols, i + 1)
    sns.scatterplot(
        data=data,
        x=trait,
        y='envelope_norm_integral_log',
        hue='modality',
        palette=modality_palette,
        alpha=0.7
    )
    # add regression line
    sns.regplot(
        data=data,
        x=trait,
        y='envelope_norm_integral_log',
        scatter=False,
        color='black',
        line_kws={'linewidth': 2}
    )
    plt.title(f'Envelope Normalized Integral vs {trait}', fontsize=16)
    plt.xlabel(trait, fontsize=14)
    plt.ylabel('Envelope Normalized Integral', fontsize=14)

BFI extra only

# torque integral
data = pd.read_csv(os.path.join(datafolder, "features_df_nonzscored_final_with_demo.csv"))

plot_relationship(data, 
                  x_var='BFI_extra', 
                  y_var='arm_moment_sum_change_integral', 
                  modalityout='vocal')

data = pd.read_csv(os.path.join(datafolder, "features_df_nonzscored_final_with_demo.csv"))

plot_relationship(data, 
                  x_var='BFI_extra', 
                  y_var='arm_moment_sum_change_peak_mean', 
                  modalityout='vocal')

# COPc integral
data = pd.read_csv(os.path.join(datafolder, "features_df_nonzscored_final_with_demo.csv"))

plot_relationship(data, 
                  x_var='BFI_extra', 
                  y_var='COPc_integral', 
                  modalityout='')

# COPc peak mean
data = pd.read_csv(os.path.join(datafolder, "features_df_nonzscored_final_with_demo.csv"))

plot_relationship(data, 
                  x_var='BFI_extra', 
                  y_var='COPc_peak_mean', 
                  modalityout='')

# Envelope integral
data = pd.read_csv(os.path.join(datafolder, "features_df_nonzscored_final_with_demo.csv"))

plot_relationship(data, 
                  x_var='BFI_extra', 
                  y_var='envelope_norm_integral', 
                  modalityout='gesture')

# Envelope peak mean
data = pd.read_csv(os.path.join(datafolder, "features_df_nonzscored_final_with_demo.csv"))

plot_relationship(data, 
                  x_var='BFI_extra', 
                  y_var='envelope_norm_peak_mean', 
                  modalityout='gesture')

Extra things

Future response

features_df = pd.read_csv(os.path.join(datafolder, "features_df_nonzscored_final.csv"))

plot_relationship(features_df, 
                  x_var='answer_fol_dist', 
                  y_var='COPc_integral', 
                  modalityout='')

plot_relationship(features_df, 
                  x_var='answer_fol_dist', 
                  y_var='COPc_peak_mean', 
                  modalityout='')

Response time

plot_relationship(features_df, 
                  x_var='response_time_sec', 
                  y_var='COPc_integral', 
                  modalityout='')

plot_relationship(features_df, 
                  x_var='response_time_sec', 
                  y_var='COPc_peak_mean', 
                  modalityout='')

Preparation time

plot_relationship(features_df, 
                  x_var='prep_time_sec', 
                  y_var='COPc_integral', 
                  modalityout='')

plot_relationship(features_df, 
                  x_var='prep_time_sec', 
                  y_var='COPc_peak_mean', 
                  modalityout='')